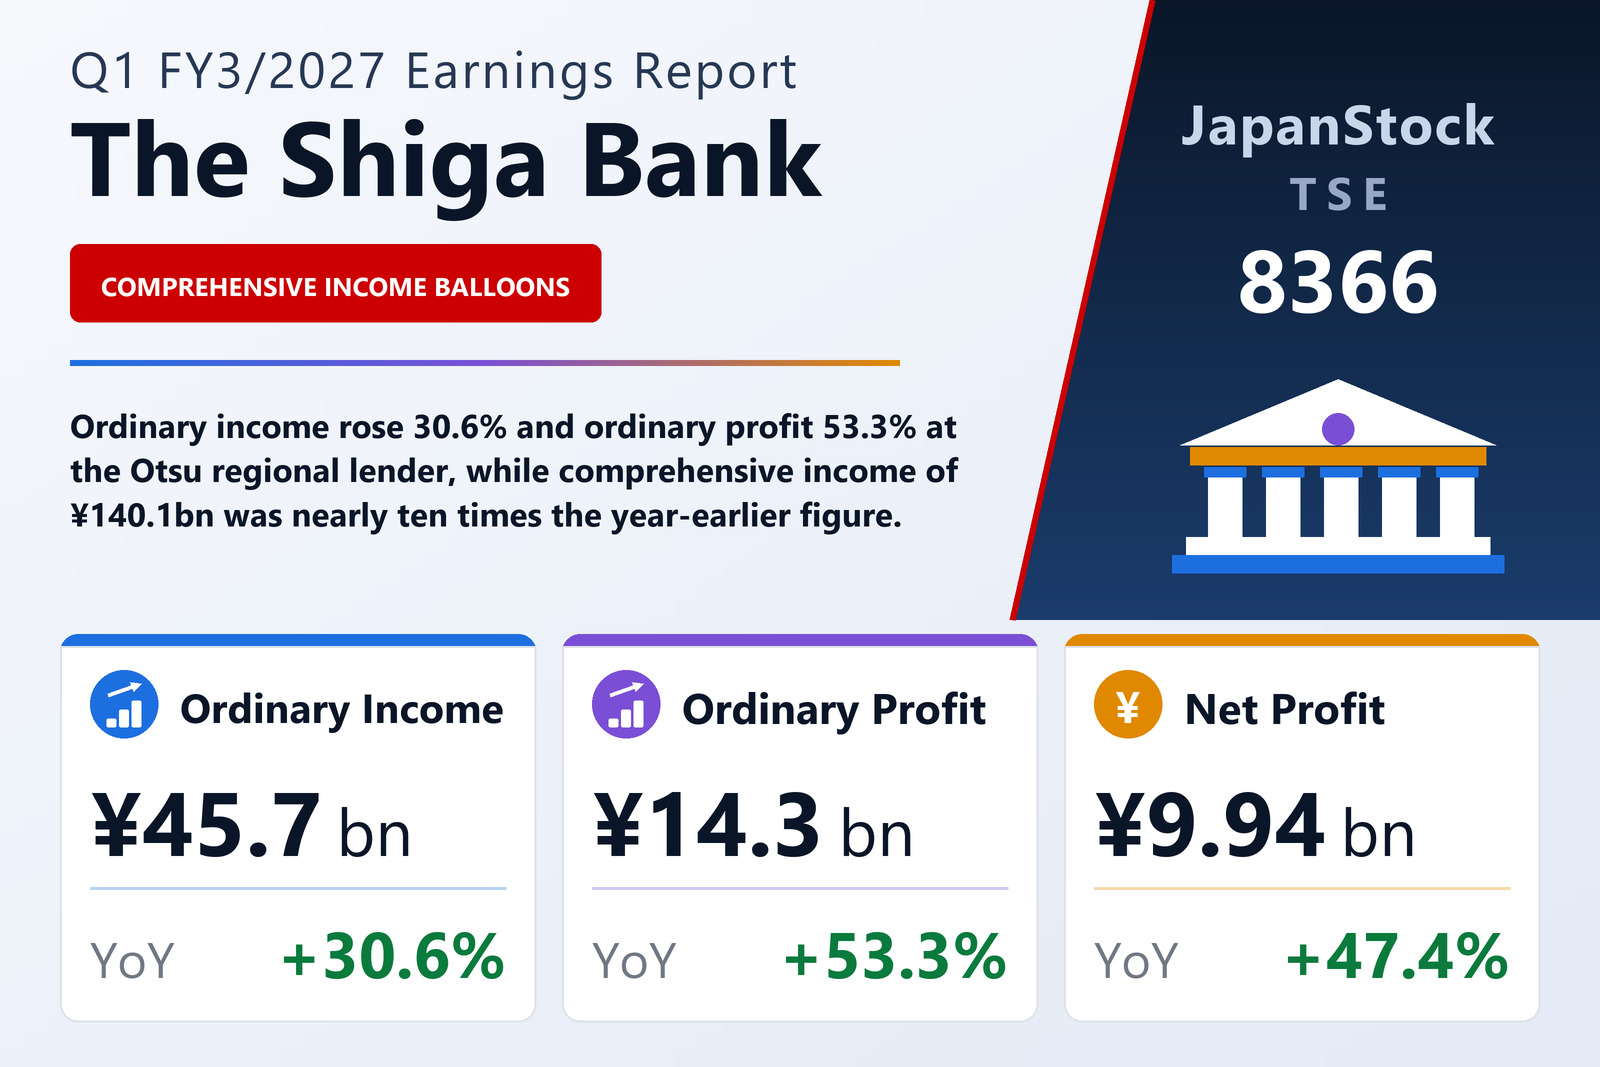
The Shiga Bank, Ltd. (TSE: 8366), the Otsu-headquartered regional lender that serves Shiga Prefecture and the wider Kansai region, reported consolidated results for the first quarter of the fiscal year ending March 2027 — the three months from April 1 to June 30, 2026 — under Japanese GAAP. Ordinary income rose 30.6% to ¥45,686 million, ordinary profit jumped 53.3% to ¥14,301 million, and net profit attributable to owners of the parent climbed 47.4% to ¥9,937 million. Basic earnings per share were ¥43.23, up from ¥29.25. No diluted figure was reported, as the bank states it has no potentially dilutive shares outstanding.
Rate-cycle revenue, and a heavier cost line to match
Ordinary income grew by ¥10,701 million year on year, and the bank attributed the gain to two sources. Interest income from lending and from securities dividends drove fund-management revenue up ¥5,115 million, the direct benefit of a domestic interest-rate environment that has turned in regional banking's favour. A further ¥4,754 million came from higher other operating income, chiefly gains on financial derivatives. Costs moved in the same direction, if less dramatically: ordinary expenses reached ¥31,384 million, up ¥5,730 million, led by a ¥3,214 million rise in other operating expenses — largely bigger losses on sales of government and other bonds — and a ¥1,664 million increase in funding costs as deposit interest paid climbed. The net of the two left ordinary profit ¥4,971 million higher than a year earlier.
¥140.1 billion of comprehensive income is not ¥140.1 billion of profit
The single most arresting number in the release is comprehensive income of ¥140,083 million, against ¥14,172 million a year earlier — a rise of 888.5%, and more than fourteen times the quarter's reported net profit. It is essential to read this correctly: comprehensive income captures unrealised valuation movements on the bank's securities book that sit outside the profit and loss account. It is not earnings, it is not distributable, and it did not pass through the ¥9,937 million net profit line. What it did do was reshape the balance sheet. Accumulated other comprehensive income rose ¥130,108 million from the fiscal year-end, driven by net unrealised gains on other securities, and the securities portfolio itself expanded to ¥1,973,421 million, up ¥251,011 million in three months. A reversal in market prices would unwind the same figure just as quickly.
An 8.1% equity ratio — but not the one bank analysts usually mean
Total assets stood at ¥7,943,892 million at June 30, up ¥274,808 million from the ¥7,669,084 million recorded at the March 2026 fiscal year-end. Net assets rose to ¥645,660 million from ¥509,025 million, an increase of ¥136,634 million that is almost entirely explained by the comprehensive-income swing described above. On the bank's own measure, that lifted the equity ratio to 8.1% from 6.6%. The bank flags explicitly that this ratio is calculated as total net assets less share subscription rights, divided by total assets, and that it is not the capital adequacy ratio defined under Japan's capital-adequacy notification — it should not be read as a Basel regulatory ratio. Elsewhere on the balance sheet, deposits grew ¥129,733 million to ¥6,080,027 million, loans edged down ¥11,687 million to ¥4,576,973 million, and borrowed money fell ¥95,658 million to ¥688,623 million.
The dividend looks slashed. It has in fact been raised sharply.
Shiga Bank executed a five-for-one stock split effective April 1, 2026, and the dividend table has to be read through that lens. For the year ended March 2026 the bank paid an interim of ¥65.00 and a year-end of ¥75.00, a total of ¥140.00 per share — figures the tanshin notes are the actual pre-split amounts. For the year to March 2027 it forecasts an interim of ¥25.00 and a year-end of ¥25.00, a total of ¥50.00 per share on the post-split share count, unchanged from its previous announcement. Multiplied by five to put it on the old basis, that ¥50.00 is equivalent to ¥250.00 pre-split, against ¥140.00 the year before — a substantial increase rather than the two-thirds cut the headline numbers superficially suggest. Per-share earnings are already restated on the same basis, so the ¥43.23 posted this quarter is directly comparable with the ¥29.25 of a year earlier.
A fast start, and guidance left deliberately untouched
Full-year guidance is unchanged from the May 13, 2026 announcement. The bank targets first-half cumulative ordinary profit of ¥20,900 million, up 33.6%, and net profit of ¥14,300 million, up 25.6%, for EPS of ¥62.21; for the full year it guides to ordinary profit of ¥42,100 million, up 45.0%, and net profit of ¥28,500 million, up 33.8%, for EPS of ¥123.98. Notably, the bank publishes no ordinary-income forecast line — only profit and per-share measures. The quarter has already delivered roughly 68% of the half-year ordinary-profit plan and 69% of the interim net-profit plan, which management explained is largely a timing effect: equity dividend receipts are concentrated in the April-to-June quarter. Against the full-year target, the ¥9,937 million of first-quarter net profit represents about 35% of plan. Management chose not to revise, citing the possibility that credit costs increase depending on the economic, price and financial environment ahead. The group reports as a single banking segment and operates no trading account; the quarterly consolidated statements were not subject to review by a certified public accountant or auditing firm.
| Metric | Q1 FY3/2027 | Q1 FY3/2026 | YoY |
|---|---|---|---|
| Ordinary income (¥ million) | 45,686 | 34,984 | +30.6% |
| Ordinary profit (¥ million) | 14,301 | 9,330 | +53.3% |
| Net profit attrib. to owners (¥ million) | 9,937 | 6,739 | +47.4% |
| Comprehensive income (¥ million) | 140,083 | 14,172 | +888.5% |
| Basic EPS (¥, post-split basis) | 43.23 | 29.25 | +47.8% |
| Total assets (¥ million, vs Mar 31, 2026) | 7,943,892 | 7,669,084 | +3.6% |
| Net assets (¥ million, vs Mar 31, 2026) | 645,660 | 509,025 | +26.8% |
| Equity ratio (%, bank's own measure) | 8.1 | 6.6 | +1.5 pt |
| Annual dividend (¥, FY3/27 forecast vs FY3/26 actual) | 50.00 | 140.00 | Post-split vs pre-split |
JapanStockPulse provides informational content only and does not constitute investment advice. Figures are taken from the company's published earnings short report and may be subject to subsequent revision.