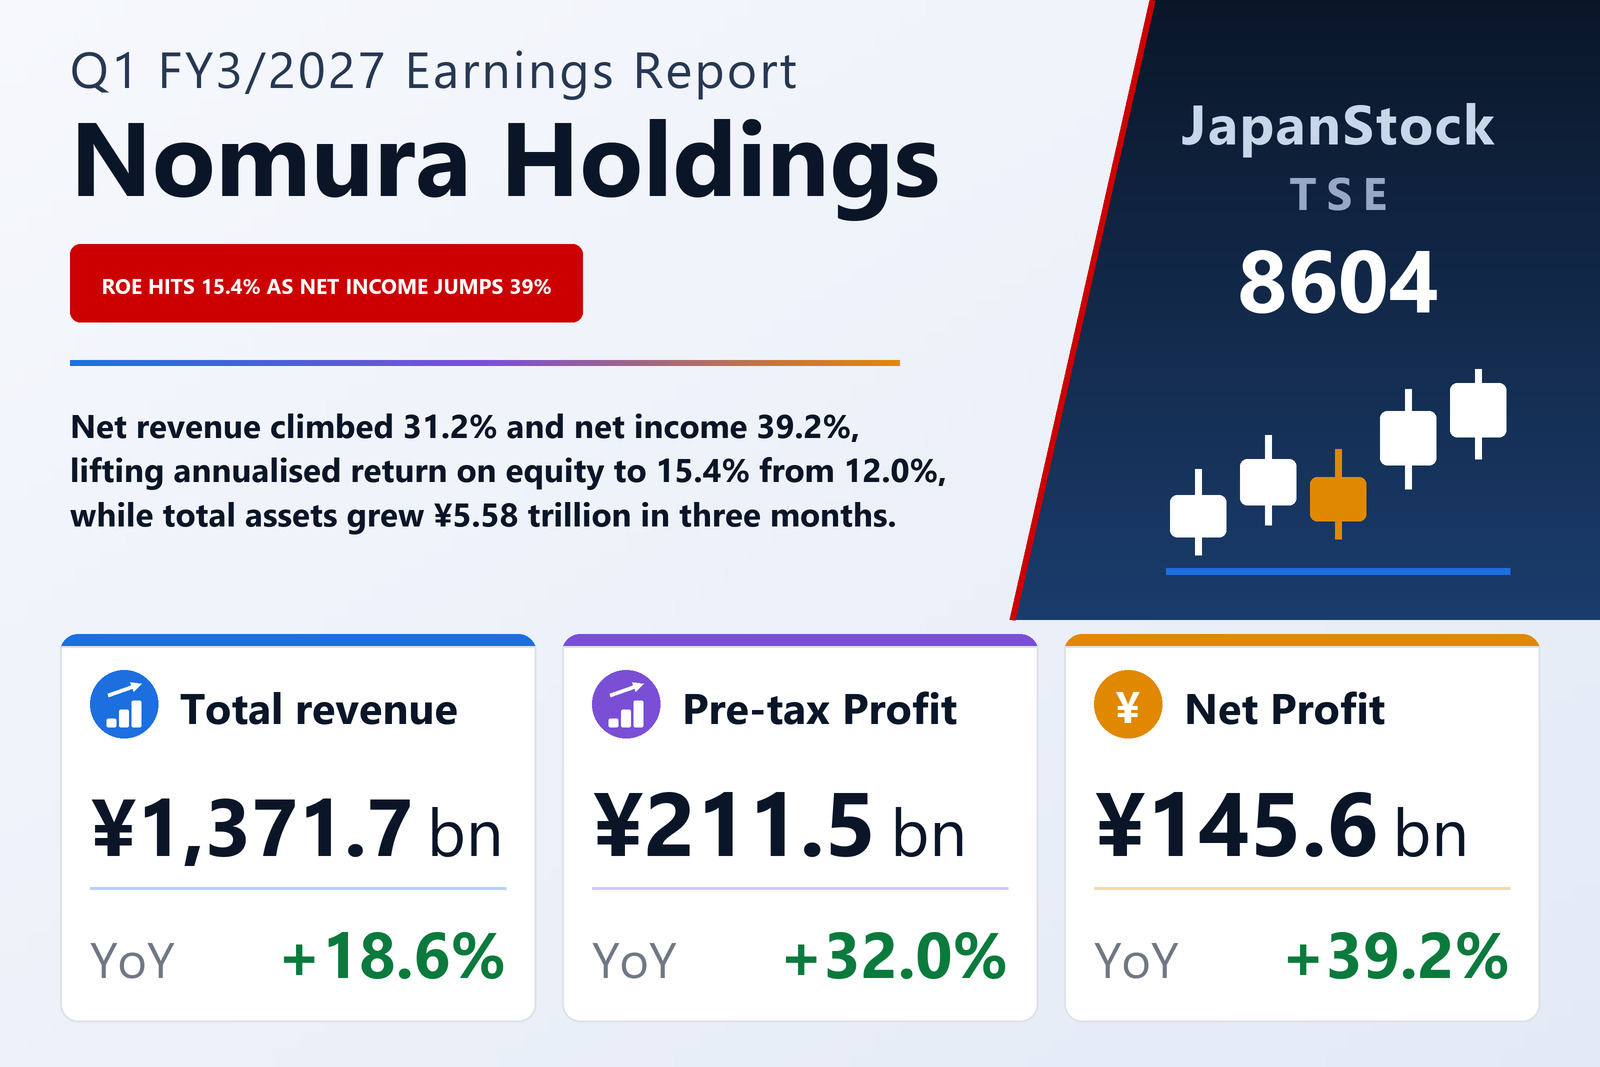
Nomura Holdings, Inc. (TSE: 8604), Japan's largest securities group and one of the few Japanese financial institutions that reports under U.S. GAAP, published consolidated results for the first quarter of the fiscal year ending March 2027 — the three months from April 1 to June 30, 2026. The company, whose shares are listed on both the Tokyo and Nagoya stock exchanges, reported total revenue of ¥1,371,708 million, up 18.6%, and net revenue — revenue after interest expense — of ¥686,714 million, up 31.2%. Income before income taxes rose 32.0% to ¥211,539 million and net income attributable to Nomura Holdings shareholders climbed 39.2% to ¥145,561 million. Basic earnings per share were ¥49.90 against ¥35.19 a year earlier, diluted EPS ¥48.34 against ¥34.04, and annualised return on shareholders' equity reached 15.4%, up from 12.0%.
Fees and trading, not financial revenue, drove the quarter
The gap between the 18.6% rise in total revenue and the 31.2% rise in net revenue is the story of the income statement. Financial revenue — the single largest gross line at ¥698,543 million — grew just 7.5%, and because interest expense rose 8.2% to ¥684,994 million, that pairing contributed almost nothing on a net basis. The growth came from the fee and trading lines instead: commissions rose 27.4% to ¥128,178 million, investment banking fees 46.6% to ¥56,236 million, asset management and portfolio service fees 74.5% to ¥162,054 million, and net gain on trading 61.9% to ¥230,292 million. Gains on private equity and debt investments were the one soft spot, down 91.1% to ¥564 million. Non-interest expenses rose 30.9% to ¥475,175 million, roughly in line with net revenue: compensation and benefits, the largest cost, rose 27.1% to ¥236,764 million, while commissions and floor brokerage jumped 66.0% to ¥74,335 million.
Divisional performance: Wholesale and Investment Management lead
On the company's own segment basis — which excludes gains and losses on certain equity securities held for operating purposes — net revenue rose 30.1% to ¥681,177 million, non-interest expenses 30.9% to ¥475,175 million and income before income taxes 28.4% to ¥206,002 million. The Wholesale division was the largest single contributor: net revenue up 41.4% to ¥369,097 million against expense growth of only 25.8%, more than doubling pre-tax income to ¥93,328 million, a rise of 122.7%. Investment Management came close to doubling its top line, with net revenue up 94.4% to ¥98,314 million and pre-tax income up 109.0% to ¥44,987 million; assets under management stood at ¥156.4 trillion at the end of June. Wealth Management lifted net revenue 37.5% to ¥145,417 million while holding expense growth to 10.9%, so pre-tax income rose 83.4% to ¥71,076 million — the cleanest example of operating leverage in the group. Banking lagged: net revenue rose 18.7% to ¥15,244 million but expenses rose faster at 25.8%, leaving pre-tax income essentially flat at ¥3,636 million, up 0.6%. The four divisions together produced pre-tax income of ¥213,027 million, up 101.3%, against which the "Other" column recorded a pre-tax loss of ¥7,025 million. The company notes that the reconciliation between its U.S. GAAP figures and its segment figures appears on page 10 of the earnings report.
A balance sheet ¥5.6 trillion larger in three months
Total assets ended the quarter at ¥68,224,010 million, up ¥5,578,085 million from ¥62,645,925 million at the March 2026 year-end — an increase management attributed principally to higher trading assets, which rose to ¥28,837,153 million from ¥26,128,073 million. Total liabilities grew ¥5,439,287 million to ¥64,230,297 million, driven by trading liabilities, while total equity added ¥138,798 million to reach ¥3,993,713 million. Shareholders' equity was ¥3,834,275 million against ¥3,707,868 million three months earlier, and book value per share improved to ¥1,311.94 from ¥1,277.99. Because the asset base expanded far faster than equity, the shareholders' equity ratio slipped to 5.6% from 5.9% — a low absolute figure that is normal for a securities balance sheet dominated by trading positions and collateralised financing, but one worth stating alongside the profit growth. Treasury shares fell to 165,970,352 from 187,225,377, and the average share count for the quarter was 2,917,278,407, down from 2,971,653,091 a year earlier.
Comprehensive income nearly tripled
Comprehensive income rose 186.4% to ¥176,502 million from ¥61,629 million, far outpacing the 39.2% gain in reported net income and pointing to large unrealised gains sitting outside the profit line. The swing came almost entirely from currency translation: translation adjustments contributed a positive ¥40,273 million this quarter against a negative ¥39,600 million a year earlier. Partly offsetting that, own-credit adjustments were a negative ¥17,069 million against a negative ¥2,432 million, and defined benefit pension adjustments a negative ¥3,051 million. Comprehensive income attributable to Nomura Holdings shareholders was ¥164,279 million, up 181.9%. Depreciation and amortisation for the quarter was ¥21,715 million, up from ¥15,407 million.
No earnings forecast — and no dividend forecast either
Nomura publishes no full-year guidance, and this quarter is no exception. The company explains that it operates a diversified investment and financial services business across the capital markets of many countries, and that those markets carry various uncertainties arising from economic conditions and market environments; for that reason it declines to state an earnings forecast. The same reasoning is applied to the dividend: for the year to March 2027, neither an interim nor a year-end payout figure is disclosed. For the year ended March 2026 the company paid an interim dividend of ¥27.00 and a year-end dividend of ¥24.00, an annual total of ¥51.00 per share. The quarterly consolidated financial statements attached to this report have not been reviewed by a certified public accountant or auditing firm; Nomura says it obtains such a review voluntarily and plans to disclose a version of the earnings report with the review report attached on August 6, 2026.
| Metric | Q1 FY3/2027 | Q1 FY3/2026 | Change |
|---|---|---|---|
| Total revenue (¥ billion) | 1,371.71 | 1,156.59 | +18.6% |
| Net revenue after interest expense (¥ billion) | 686.71 | 523.32 | +31.2% |
| Non-interest expenses (¥ billion) | 475.18 | 363.03 | +30.9% |
| Income before income taxes (¥ billion) | 211.54 | 160.28 | +32.0% |
| Net income attrib. to NHI shareholders (¥ billion) | 145.56 | 104.57 | +39.2% |
| Comprehensive income (¥ billion) | 176.50 | 61.63 | +186.4% |
| Basic EPS (¥) | 49.90 | 35.19 | +41.8% |
| Diluted EPS (¥) | 48.34 | 34.04 | +42.0% |
| Annualised ROE (%) | 15.4 | 12.0 | +3.4 pt |
| Total assets (¥ trillion, Jun 30 vs Mar 31, 2026) | 68.22 | 62.65 | +8.9% |
| Shareholders' equity ratio (%, Jun 30 vs Mar 31, 2026) | 5.6 | 5.9 | −0.3 pt |
| Book value per share (¥, Jun 30 vs Mar 31, 2026) | 1,311.94 | 1,277.99 | +2.7% |
| Annual dividend (¥, FY3/27 forecast vs FY3/26 actual) | Not disclosed | 51.00 | — |
JapanStockPulse provides informational content only and does not constitute investment advice. Figures are taken from the company's published earnings short report and may be subject to subsequent revision.