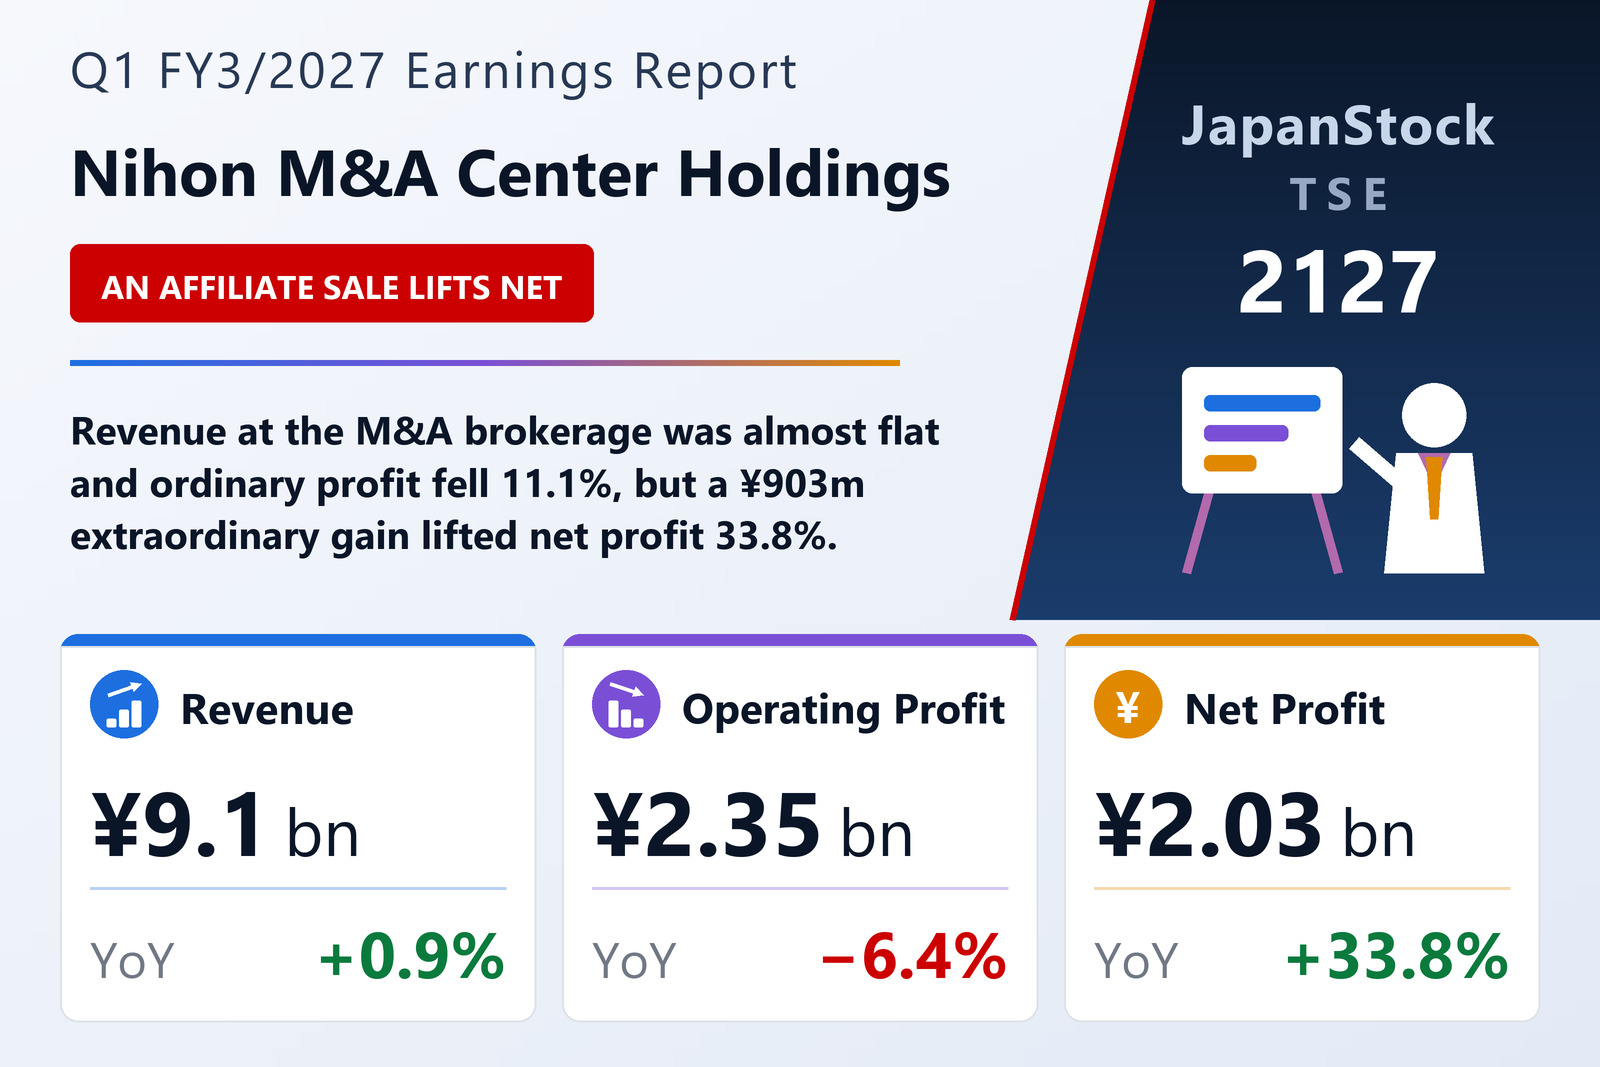
Nihon M&A Center Holdings Inc. (TSE: 2127), Japan's largest independent broker of small- and mid-sized business-succession deals, reported consolidated results for the first quarter of the fiscal year ending March 2027 — the three months from April 1 to June 30, 2026 — under Japanese GAAP. Revenue rose 0.9% to ¥9,104 million, operating profit fell 6.4% to ¥2,349 million and ordinary profit fell 11.1% to ¥2,252 million, but net profit attributable to owners of the parent rose 33.8% to ¥2,027 million on the back of a gain booked below the ordinary line. Basic earnings per share were ¥6.39, up from ¥4.78; no diluted figure was reported. Comprehensive income more than kept pace, rising 71.2% to ¥2,301 million.
Fewer closings, but richer and better-quality mandates
The company completed 188 deals in the quarter, down 11.3% year on year — a decline it presented as deliberate, saying it concentrated management resources on expanding new mandates and improving the "quality" of the mandates it takes on in order to build a stronger pipeline toward its guidance. The leading indicators moved the other way. New sell-side mandates reached 347, up 20.1%, and within that total the mid-cap bracket — companies with revenue of ¥1 billion or more, or profit of ¥50 million or more — grew 31.0% to 76. Large deals carrying a success fee of ¥100 million or more closed at a rate of 19 pairings, up 35.7%. The mix shift showed up in unit economics: M&A revenue per completed deal held at a high ¥46.3 million, up 13.4%, which is what allowed the top line to edge higher on a smaller number of closings. Management said it would keep tightening process control from first meeting through to closing and continue to prioritise mandate quality in the coming quarters.
IT spending trims the operating margin, non-operating losses widen the gap
Cost of sales was ¥3,610 million, down 0.8%, so the pressure came entirely from below the gross line: selling, general and administrative expenses rose 9.5% to ¥3,144 million, which the company attributed largely to higher IT-related costs tied to its push into data-driven management. That left the operating margin at 25.8% against 27.8% a year earlier. Ordinary profit then fell further than operating profit because the non-operating lines reversed: non-operating income halved to ¥31 million from ¥62 million, while non-operating expenses more than tripled to ¥127 million from ¥39 million, including a ¥54 million equity-method investment loss, a ¥30 million loss on investment-partnership holdings and a ¥26 million foreign-exchange loss. The ordinary profit margin came to 24.7%, down 3.4 percentage points year on year.
A fund-business exit carries the bottom line
Below ordinary profit, Nihon M&A Center booked ¥903 million of extraordinary income, of which ¥848 million was a gain on the sale of shares in affiliated companies; the company said the item mainly reflected a ¥787 million gain on the disposal of an investment holding inside its fund business. Extraordinary losses were negligible, limited to a rounding-level loss on the sale of fixed assets. Pre-tax quarterly profit therefore reached ¥3,156 million, up from ¥2,533 million, and after ¥950 million of income taxes, quarterly net profit was ¥2,206 million, of which ¥178 million was attributable to non-controlling interests and ¥2,027 million to owners of the parent. Stripping the gain out, the underlying trend at the ordinary-profit line is a decline, so the headline 33.8% jump in net profit is a one-off-assisted figure rather than a step-change in operating earnings.
"Second Founding" targets ¥30 billion of ordinary profit by FY3/2033
The company frames the year to March 2027 as the start of a "Second Founding," aimed at consolidated ordinary profit of ¥30.0 billion in the fiscal year ending March 2033. Groundwork in the quarter included a redesign of the corporate philosophy framework, a rebuild of the sales organisation, the introduction of a share-remuneration trust and preparation for an expanded relocation of the Tokyo head office. On the data side, its AI meeting-analysis service "Bring Out" had accumulated information on roughly 3,300 seller companies and 10,500 candidate buyers as of the end of June 2026, generating about 12,500 high-affinity matches during the quarter, and work has begun on a "deal chart" that consolidates historical and live deal data. Regional coverage was extended through succession seminars at 25 venues nationwide, new staffed consultation desks in Niigata, Miyagi, Ibaraki, Shizuoka and Yamaguchi prefectures, and 15 satellite offices. Joint ventures with regional banks — NOBUNAGA Succession with Juroku Financial Group, Kyushu M&A Advisors with Higo Bank and Taiwan's E.SUN Venture Capital, and Okigin Success Partners with Bank of Okinawa — continue to operate. Abroad, the group signed a memorandum of understanding toward a business alliance with U.S. mid-market adviser Generational Group, started joint PMI research with Kwansei Gakuin University, and in April 2026 established J-Capital Inc. as the intermediate holding company for its fund business, which was newly consolidated in the quarter while AtoG1 Inc. was removed from the consolidation scope.
A large dividend payout shrinks the balance sheet; equity ratio jumps to 87.3%
Total assets fell 17.8%, or ¥11,780 million, to ¥54,442 million from the March 2026 year-end. Current assets dropped 21.3% to ¥34,426 million as cash and deposits fell ¥7,520 million to ¥32,927 million and accounts receivable fell ¥206 million to ¥602 million; non-current assets fell 10.9% to ¥20,015 million, mainly on a ¥1,864 million decline in investment securities to ¥14,623 million and a ¥588 million reduction in deferred tax assets. Liabilities fell even faster, down 56.9% to ¥6,710 million: current liabilities collapsed 63.3% to ¥4,825 million as income taxes payable fell ¥3,628 million and accrued expenses fell ¥2,362 million, while non-current liabilities fell 23.0% to ¥1,885 million on a ¥700 million reduction in long-term borrowings. Net assets declined 5.7% to ¥47,732 million, with retained earnings down ¥2,731 million as the ¥2,027 million of quarterly profit was outweighed by ¥4,759 million of dividends paid. Because liabilities shrank far more than equity, the equity ratio rose to 87.3% from 75.8% at the year-end.
Guidance unchanged; ¥29 annual dividend includes a ¥4 special
Nihon M&A Center left the forecasts it published on April 30, 2026 untouched. The first-half plan calls for revenue of ¥23,900 million (+5.8%), operating profit of ¥8,600 million (+2.4%), ordinary profit of ¥8,600 million (+0.3%), net profit of ¥6,200 million (+14.6%) and EPS of ¥19.46. The full-year plan is revenue of ¥52,800 million (+5.1%), operating profit of ¥19,300 million (+2.9%), ordinary profit of ¥19,300 million (+0.8%), net profit of ¥13,400 million (+7.3%) and EPS of ¥41.91. The first quarter therefore represents about 17% of the full-year revenue plan and roughly 12% of the operating-profit plan — a back-loaded shape typical of a business whose fees crystallise on closing, but one that leaves the remaining nine months carrying most of the work. The dividend forecast is likewise unchanged: an interim of ¥14.00 (¥12.00 ordinary plus ¥2.00 special) and a year-end of ¥15.00 (¥13.00 ordinary plus ¥2.00 special), for an annual ¥29.00 that matches the prior year and includes ¥4.00 of special dividend. Supplementary explanatory material was prepared and a results briefing for institutional investors was held; the quarterly financial statements were not subject to review by a certified public accountant or auditing firm, and an accounting-policy change was applied following a revision to accounting standards.
| Metric | Q1 FY3/2027 | Q1 FY3/2026 | YoY |
|---|---|---|---|
| Revenue (¥ million) | 9,104 | 9,018 | +0.9% |
| Operating profit (¥ million) | 2,349 | 2,509 | −6.4% |
| Operating margin (%) | 25.8 | 27.8 | −2.0 pt |
| Ordinary profit (¥ million) | 2,252 | 2,533 | −11.1% |
| Ordinary profit margin (%) | 24.7 | 28.1 | −3.4 pt |
| Net profit attributable to owners of parent (¥ million) | 2,027 | 1,515 | +33.8% |
| Basic EPS (¥) | 6.39 | 4.78 | +33.7% |
| Completed deals | 188 | 212 | −11.3% |
| M&A revenue per deal (¥ million) | 46.3 | 40.8 | +13.4% |
| Total assets (¥ million, vs FY3/26 year-end) | 54,442 | 66,223 | −17.8% |
| Equity ratio (%, vs FY3/26 year-end) | 87.3 | 75.8 | +11.5 pt |
| FY3/27 revenue plan (¥ million) | 52,800 | — | +5.1% |
| FY3/27 operating profit plan (¥ million) | 19,300 | — | +2.9% |
| FY3/27 net profit plan (¥ million) | 13,400 | — | +7.3% |
| Annual dividend (¥, FY3/27 forecast vs FY3/26 actual) | 29.00 | 29.00 | ±0 |
JapanStockPulse provides informational content only and does not constitute investment advice. Figures are taken from the company's published earnings short report and may be subject to subsequent revision.