Profit grew faster than revenue — but only down to the ordinary line
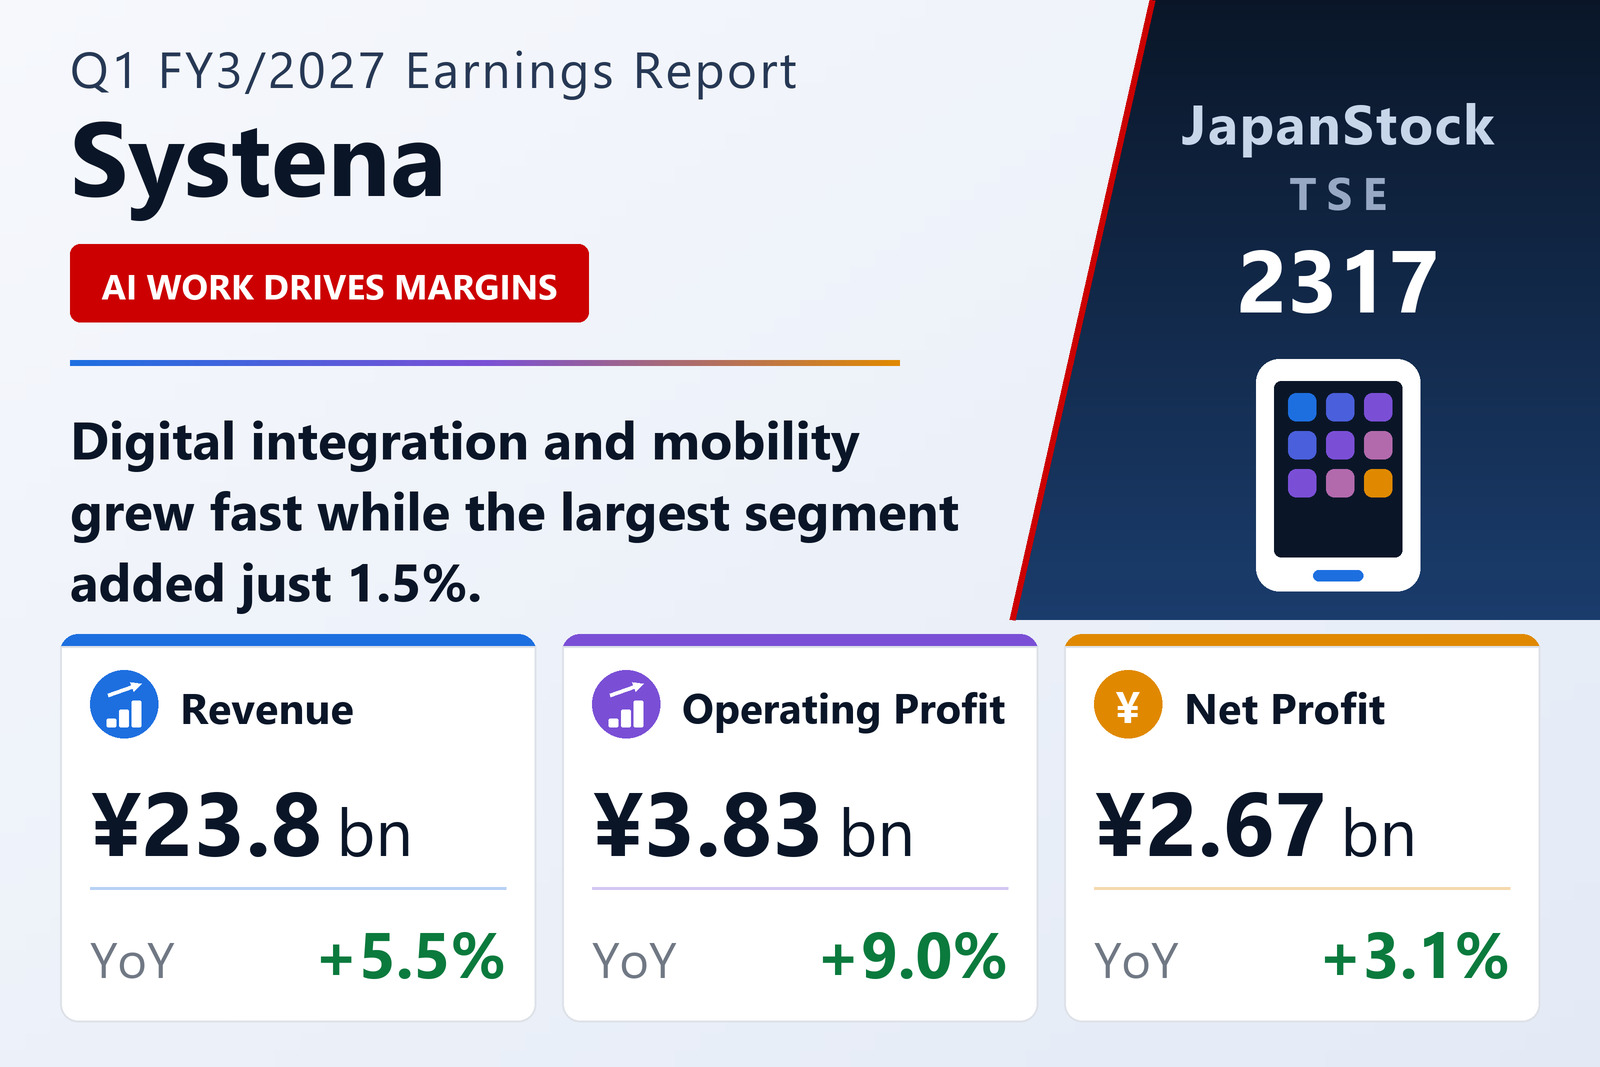
Systena Corporation (TSE: 2317), the Tokyo-based IT services group, disclosed consolidated first-quarter results for the fiscal year ending March 2027 — April 1 to June 30, 2026 — under Japanese GAAP on July 30, 2026. Revenue rose 5.5% to ¥23,799 million from ¥22,553 million, operating profit rose 9.0% to ¥3,834 million, ordinary profit rose 6.3% to ¥3,984 million, and net profit attributable to owners of parent rose 3.1% to ¥2,668 million. Earnings per share were ¥7.46 against ¥7.24; no diluted figure is reported. Comprehensive income was ¥2,681 million, up 4.8%.
The company also publishes its own headline measure, EBITDA+S — operating profit plus depreciation plus share-based compensation expense — which rose 14.2% to ¥4,131 million. That is the fastest-growing line in the release, and the reason is worth naming: the current quarter carried ¥209 million of share-based compensation against none a year earlier, alongside ¥87 million of depreciation versus ¥101 million. Roughly two-fifths of the metric's ¥514 million increase therefore comes from an expense line that did not exist in the base period rather than from underlying trading. (Figures below ¥1 million are truncated throughout the release, so the components do not always foot exactly.)
The step-down through the profit lines is arithmetically explicable. Net non-operating income was ¥150 million this quarter — ¥299 million of income against ¥149 million of expense — versus ¥231 million a year earlier, when expenses were a negligible ¥7 million. This year's non-operating income was led by a ¥169 million gain on sales of securities, while expenses included a ¥71 million valuation loss on crypto assets (Systena carries ¥398 million of them on the balance sheet and bought ¥70 million more during the quarter) and a ¥58 million securities valuation loss. Below that, the tax charge rose to ¥1,318 million from ¥1,180 million, lifting the effective rate to 33.1% from 31.5% — which is what converts a 6.3% gain at the ordinary line into a 3.1% gain at the net line.
The segment map was rebuilt this quarter
The most important context for reading anything below the group total is that Systena reorganised and partly renamed its reporting segments in this quarter, reflecting changes in what each business actually does and a clean-up of the business portfolio. Two structural moves drive it. Of the four consolidated subsidiaries previously grouped under "Other", GaYa Inc. and Synclogic Inc. became material enough to be split out as a standalone Online Solutions segment; separately, IDY Inc. and Systena America Inc. were moved into Next-Generation Mobility. On top of that, some Project Management Design projects were transferred into Digital Integration and IT & DX Services as part of portfolio optimisation.
Prior-year comparatives have been restated onto the new basis, so the year-on-year percentages below are like-for-like — but they are not comparable with anything Systena published before this quarter. Seven segments now report, and the ¥247 million of unallocated costs held in "adjustments" is itself explained: ¥38 million of rent on a new site during the period before occupancy, and the ¥209 million of share-based compensation for paid stock options that also sits inside the EBITDA+S add-back.
The growth engines: Digital Integration, Mobility and two small units
Digital Integration was the strongest performer of any size, with revenue up 25.4% to ¥3,235 million and segment profit up 36.9% to ¥786 million — profit growth running roughly half again as fast as revenue growth, which is the signature of a genuine mix shift rather than volume alone. The work is modernisation of mission-critical core systems for financial institutions plus new DX development including government digitalisation, and the company says it is shifting resources into higher-value SaaS solutions and cloud technical consulting while accumulating practical experience in AI-driven development.
Next-Generation Mobility — now the home of the overseas business and IDY as well as the former mobility development area — grew revenue 17.2% to ¥2,176 million and profit 23.5% to ¥872 million. Demand comes from the acceleration of software-defined vehicle (SDV) development at Japanese carmakers, in in-vehicle cockpit, connected and HMI work, plus IoT and 5G edge gateways and M2M wireless. Systena's position here is unusual for a Japanese IT services house: it works from the most upstream process inside major domestic automakers and Tier-1 suppliers on a direct-contract basis, is creating test projects in North America, and is now cross-selling IDY's communications edge-terminal technology into those accounts.
The two smallest segments produced the largest percentages and the least money. Online Solutions, newly separated around GaYa and Synclogic, reported revenue of ¥251 million — the company puts the increase at 617.5% against a restated ¥34 million — and segment profit of ¥30 million, up a reported 245.8%. Synclogic only became a consolidated subsidiary in the fourth quarter of the previous year, so most of that is consolidation arithmetic rather than trading momentum. DX & Stock-Type Business, built around Systena's own no-code DX platform Canbus., saw revenue slip 1.4% to ¥613 million while profit jumped a reported 208.7% to ¥93 million — an unusually pure margin story, as the subscription base expanded and higher-value implementation customisation and DX-adoption support grew within a flat top line.
The drag: Business Solutions flat, Project Management Design down 8.6%
Business Solutions is the group's largest segment by revenue at ¥8,579 million, or roughly 36% of the segment total, and it grew just 1.5%, with profit up 3.4% to ¥732 million. The company is explicit about why: the Windows 10 replacement bulge has passed. What kept the segment growing at all was continuing demand in cloud migration, security and networking, including multi-cloud migration and zero-trust security wins. The stated strategy is to accelerate away from product resale toward higher-value systems integration covering AI deployment platforms and AI PCs end to end — necessary, given that a segment this large growing at 1.5% caps what the group total can do.
Project Management Design was the only segment to shrink, with revenue down 8.6% to ¥3,340 million. The profit decline was far shallower at 1.8%, to ¥774 million, which is the interesting part: the segment's operating margin actually rose to 23.2% from 21.6%. Systena describes deliberately redeploying resources toward large-scale SDV development, financial-system renewals and upstream AI work, and says project unit prices and a high level of profitability were maintained. Some of the lost revenue also went sideways within the group, into Digital Integration and IT & DX Services, under the portfolio reshuffle described above. The remaining segment, IT & DX Services — the recurring-revenue base built on "accompanying-style" PMO services, expanded security support and a three-company BPO structure — grew revenue 5.5% to ¥5,727 million and profit 13.3% to ¥793 million.
Systena's supplementary order data offers a cooler forward signal than the revenue table does. Group order intake for the quarter was ¥14,688 million, or 93.9% of the prior-year quarter, even as revenue rose 5.5%; the order backlog was ¥23,262 million, at 104.0%. The divergence is sharpest exactly where revenue looked best: Next-Generation Mobility took orders of ¥1,476 million, only 61.8% of the year-earlier figure, with backlog at 94.4%, and Project Management Design's intake ran at 76.7%. Digital Integration was the counterweight, with orders at 126.5% and backlog at 113.6%. These tables cover only the segments whose services involve build-to-order production, so they are a partial view — but they suggest the mobility revenue surge is drawing on backlog rather than being replenished at the same rate.
Balance sheet: assets down ¥2,966 million, equity ratio up 2.9 points
Total assets fell to ¥58,113 million at June 30, 2026, down ¥2,966 million from ¥61,079 million three months earlier. Current assets accounted for most of it, down ¥2,497 million to ¥51,620 million on a ¥1,888 million fall in notes and accounts receivable and contract assets and a ¥793 million fall in cash and deposits. Non-current assets fell ¥469 million to ¥6,492 million, largely a ¥481 million reduction in deferred tax assets — the mirror image of the ¥481 million of deferred tax expense in the income statement.
Liabilities fell further still, down ¥3,021 million to ¥17,837 million, on a ¥2,653 million reduction in income taxes payable and a ¥1,175 million reduction in the bonus provision — both ordinary first-quarter seasonal payouts. Net assets edged up ¥55 million to ¥40,276 million, but the composition matters: retained earnings actually fell ¥204 million, because the ¥2,872 million dividend paid during the quarter exceeded the ¥2,668 million of quarterly profit, and the increase came instead from ¥273 million of newly issued share acquisition rights. Owners' equity consequently slipped to ¥39,411 million from ¥39,612 million and book value per share to ¥110.26 from ¥110.82. The equity ratio nevertheless rose 2.9 points to 67.8% — because the asset base contracted faster than equity did, not because equity grew.
Cash flow was comfortably positive. Operating cash flow was ¥1,883 million against ¥1,332 million a year earlier, up 41.4%, helped by a ¥1,889 million reduction in trade receivables and despite ¥3,354 million of income taxes paid. Investing activities produced a net inflow of ¥235 million — against a ¥534 million outflow a year earlier — as ¥2,952 million of proceeds from sales of securities more than covered ¥2,673 million of purchases. Financing used ¥2,805 million, almost all of it the ¥2,836 million dividend payment, partly offset by ¥63 million from the issuance of share acquisition rights. Cash and cash equivalents ended the quarter at ¥29,139 million, down ¥680 million from ¥29,819 million at the start of the year.
Guidance untouched — and it still points to lower profit for the year
Systena left its FY3/2027 guidance exactly as issued on May 13, 2026. It expects full-year revenue of ¥98,000 million, up 3.8%, EBITDA+S of ¥17,250 million, up 9.0%, and operating profit of ¥15,960 million, up 3.9%. Below that the forecast turns down: ordinary profit of ¥15,960 million, a fall of 1.1%, and net profit attributable to owners of parent of ¥10,630 million, a fall of 6.0%, for forecast EPS of ¥29.74. The guided EBITDA+S is built from operating profit of ¥15,960 million plus ¥450 million of depreciation and ¥840 million of share-based compensation.
That shape — revenue and operating profit up, ordinary and net profit down — is unusual, and it means the guided ordinary profit exactly equals guided operating profit, implying no net non-operating contribution for the year against a positive one last year. Set the quarter against those targets and Systena is running at or ahead of a straight line on every measure: Q1 operating profit is 24.0% of the full-year figure, revenue 24.3%, ordinary profit 25.0% and net profit 25.1%. Given that the company is guiding its own net profit down for the year, a first quarter delivering a quarter of it is comfortably on track rather than merely adequate.
On shareholder returns, the FY3/2027 dividend forecast is unrevised at ¥9.00 interim plus ¥9.00 year-end, or ¥18.00 for the year, against ¥14.00 paid for FY3/2026 (¥6.00 interim, ¥8.00 year-end) — an increase of 28.6%. Against forecast EPS of ¥29.74 that implies a payout ratio of about 61%, up sharply, and it is being raised in a year the company itself expects net profit to decline. There were no changes to the scope of consolidation, no special quarterly accounting treatments and no accounting-policy changes, and the quarterly consolidated statements were not reviewed by an accounting auditor.
| Metric | Q1 FY3/2027 | Q1 FY3/2026 | Change |
|---|---|---|---|
| Revenue (¥ million) | 23,799 | 22,553 | +5.5% |
| EBITDA+S (¥ million) | 4,131 | 3,617 | +14.2% |
| Operating profit (¥ million) | 3,834 | 3,516 | +9.0% |
| Ordinary profit (¥ million) | 3,984 | 3,747 | +6.3% |
| Net profit attrib. to owners of parent (¥ million) | 2,668 | 2,589 | +3.1% |
| Comprehensive income (¥ million) | 2,681 | 2,558 | +4.8% |
| EPS (¥) | 7.46 | 7.24 | +3.0% |
| Next-Generation Mobility revenue (¥ million) | 2,176 | 1,856 | +17.2% |
| Next-Generation Mobility profit (¥ million) | 872 | 706 | +23.5% |
| Project Management Design revenue (¥ million) | 3,340 | 3,656 | −8.6% |
| Project Management Design profit (¥ million) | 774 | 788 | −1.8% |
| Digital Integration revenue (¥ million) | 3,235 | 2,580 | +25.4% |
| Digital Integration profit (¥ million) | 786 | 574 | +36.9% |
| IT & DX Services revenue (¥ million) | 5,727 | 5,429 | +5.5% |
| IT & DX Services profit (¥ million) | 793 | 700 | +13.3% |
| Business Solutions revenue (¥ million) | 8,579 | 8,453 | +1.5% |
| Business Solutions profit (¥ million) | 732 | 707 | +3.4% |
| DX & Stock-Type Business revenue (¥ million) | 613 | 622 | −1.4% |
| DX & Stock-Type Business profit (¥ million) | 93 | 30 | +208.7% |
| Online Solutions revenue (¥ million) | 251 | 34 | +617.5% |
| Online Solutions profit (¥ million) | 30 | 8 | +245.8% |
| Operating cash flow (¥ million) | 1,883 | 1,332 | +41.4% |
| Total assets (¥ million; vs Mar 31, 2026) | 58,113 | 61,079 | −4.9% |
| Net assets (¥ million; vs Mar 31, 2026) | 40,276 | 40,221 | +0.1% |
| Equity ratio (vs Mar 31, 2026) | 67.8% | 64.9% | +2.9 pt |
| Book value per share (¥; vs Mar 31, 2026) | 110.26 | 110.82 | −¥0.56 |
JapanStockPulse provides informational content only and does not constitute investment advice. Figures are taken from the company's published earnings short report and may be subject to subsequent revision.