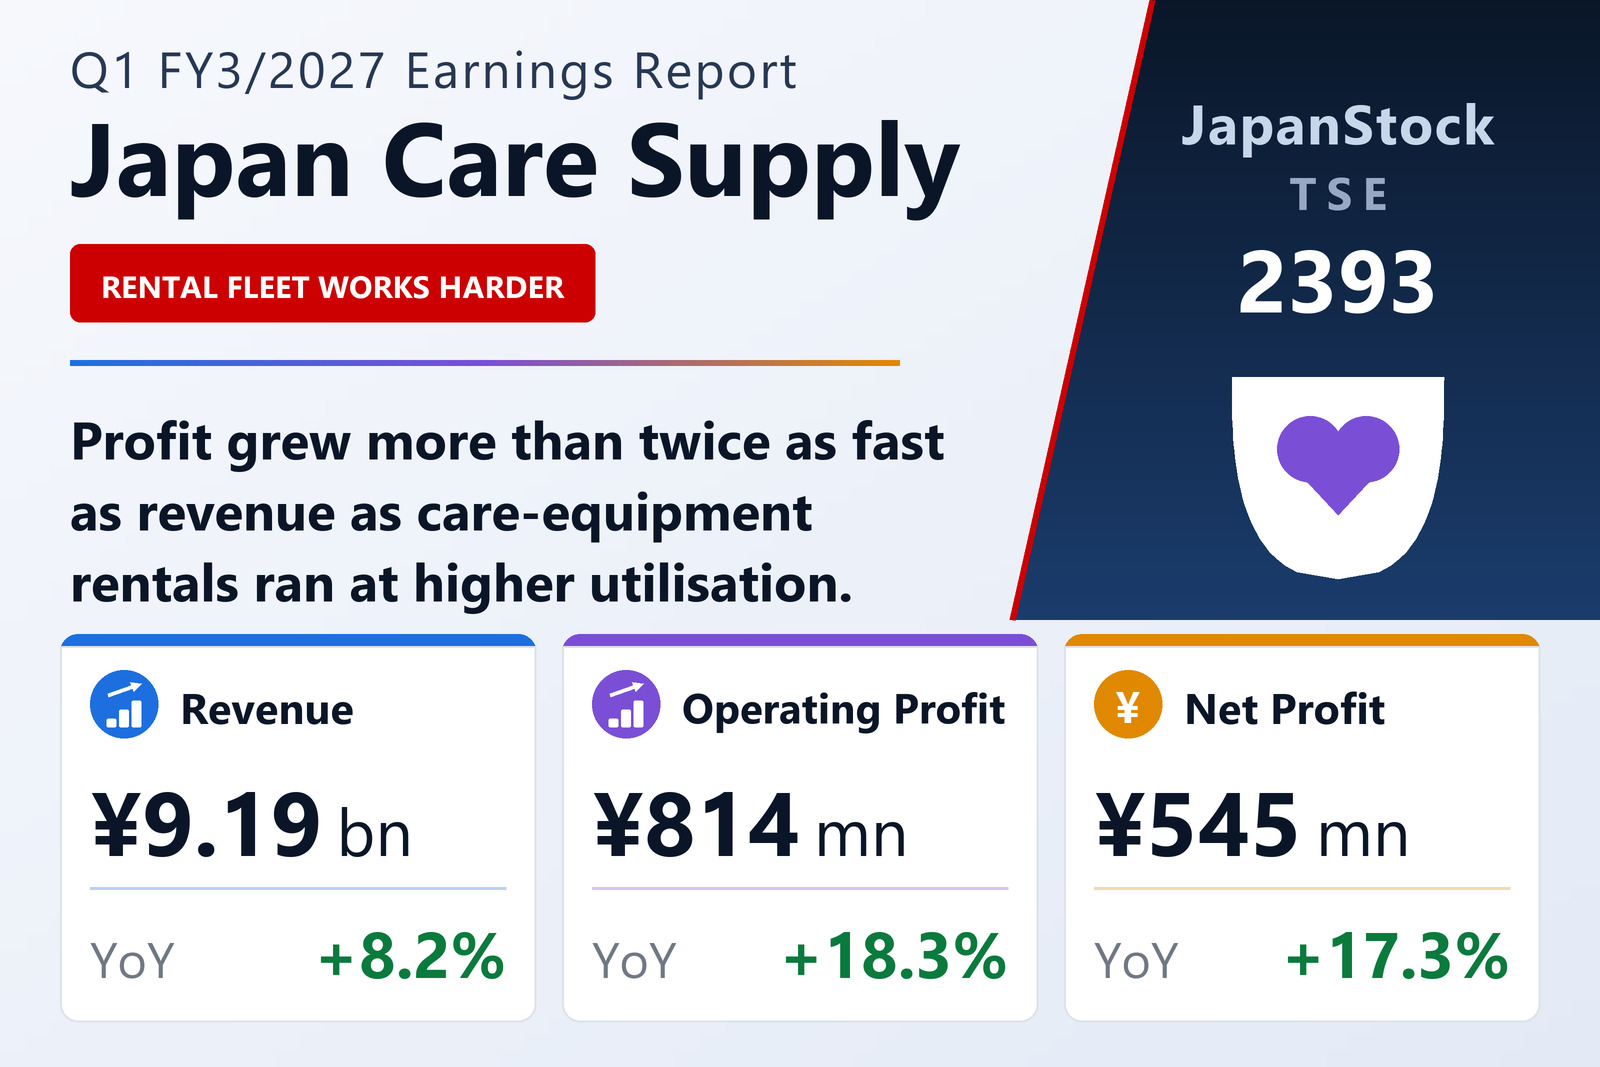
A quarter that grew profit twice as fast as revenue
Japan Care Supply Co., Ltd. (TSE: 2393), the wholesale renter of welfare and nursing-care equipment, disclosed consolidated first-quarter results for the fiscal year ending March 2027 — April 1 to June 30, 2026 — under Japanese GAAP on July 30, 2026. Revenue rose 8.2% to ¥9,193 million from ¥8,499 million. Operating profit rose 18.3% to ¥814 million, ordinary profit rose 18.3% to ¥827 million, and net profit attributable to owners of parent rose 17.3% to ¥545 million. Earnings per share came in at ¥35.08 against ¥29.90, and comprehensive income rose 21.2% to ¥541 million.
The gap between an 8.2% top line and an 18.3% operating line is the quarter's central fact, and the arithmetic behind it is unglamorous. Cost of sales rose 7.5% to ¥5,831 million — slower than revenue — lifting gross profit 9.3% to ¥3,361 million and nudging the gross margin to 36.6% from 36.2%. Selling, general and administrative expenses rose only 6.7% to ¥2,547 million, slower still, so the SG&A ratio fell to 27.7% from 28.1%. Two modest points of operating leverage, one on each side of gross profit, compound into an operating margin of 8.9% against 8.1%.
None of that means costs were absent. The company names three that rose: depreciation on rental assets it purchased, provisions for rental-asset maintenance, and personnel costs. Depreciation and amortisation alone reached ¥1,874 million against ¥1,791 million, up 4.6% — a figure larger than the whole of operating profit, which is what a rental balance sheet looks like from the income statement. Below the operating line, non-operating income of ¥15 million (including a ¥10 million equity-method investment gain and a ¥1 million foreign-exchange gain) against ¥2 million of interest expense, down from ¥3 million, carried ordinary profit to ¥827 million. A ¥93 thousand fixed-asset retirement loss left pre-tax profit at ¥826 million, income taxes took ¥281 million for an effective rate of about 34.0%, and non-controlling interests took a rounding sliver.
Worth holding onto: the base was not an easy one. The comparable quarter a year earlier had itself grown revenue 10.6%, operating profit 35.7%, ordinary profit 33.6% and net profit 33.5%. This is growth stacked on a demanding comparison rather than a rebound from a weak one. The quarterly consolidated statements were not reviewed by an accounting auditor; tax expense was computed using an estimated full-year effective rate, a treatment specific to quarterly reporting; and because the group operates a single reportable segment — senior living support — no segment breakdown is disclosed.
Rental wholesale carries it, with facility sales and meals alongside
The company attributes the revenue gain to firm trading in welfare-equipment rental wholesale, its core business, and it lists three levers rather than one. It ran sales activity tailored to the characteristics of each region; it deployed rental assets aggressively while operating that fleet efficiently; and it strengthened recruitment, retention and staff development nationwide. The third of those is the least visible and arguably the most binding — a rental network is only as good as the people who assess, deliver, fit and service the equipment, and it is exactly the constraint Japan's care sector is short of.
In wholesale product sales, the company broadened its product line-up aimed at nursing-care facilities and used its various networks to push distribution into them, extending a business built around home care into institutional customers. In senior living-support services, it worked to expand orders through its business-to-business e-commerce site and its meal service. For meals specifically it ran promotional activity to raise awareness of its "Balance Bento" boxed meals and used TV shopping as a first step toward reaching consumers directly — a tentative move beyond the business-to-business channel that has defined the group. All of it sits under the long-term vision the company calls "Care Supply Vision 2040".
One hundred locations, and a network still moving into the cities
Physical reach is the other half of the model, and the company kept extending it. It continued opening new offices in growth areas and relocating existing sites into larger warehouses, concentrating on urban areas where the population aged 75 and over is rising — the cohort that generates most demand for rented care equipment. A Shiga branch opened in April 2026 and the Kashiwa branch relocated in June. At the quarter-end the group operated 100 locations. Alongside that, it invested in human capital through initiatives on women's advancement in the workplace and expanded education and training.
The policy backdrop is unusually active. Under Japan's long-term care insurance system, discussion is under way toward the fiscal 2027 revision, following the direction set out by the review panel on "the shape of service provision toward 2040" — covering expanded comprehensive regional support systems tailored to local circumstances and the stable securing and retention of welfare workers. Separately and more immediately, an extraordinary +2.03% revision to long-term care fees took effect in June 2026, aimed at improving pay in response to the wage gap between the care sector and other industries. That revision lands one month into the quarter under review, so its effect here is partial at best. On the macro side, the company describes an economy in moderate recovery on improving employment and income conditions, but flags instability in the Middle East and the price rises flowing from it as reasons the outlook stays cloudy.
Balance sheet: dividends and borrowings take 3.3 points off the equity ratio
Total assets stood at ¥28,191 million at June 30, 2026, up ¥457 million from ¥27,734 million at the previous fiscal year-end. The increase is spread across three items and is a picture of a growing rental fleet: rental receivables rose ¥148 million, rental assets within tangible fixed assets rose ¥146 million net, and other items rose ¥166 million net.
Total liabilities rose ¥1,083 million to ¥10,207 million, and almost the entire move is one line — short-term borrowings rose ¥1,050 million, doubling to ¥2,100 million from ¥1,050 million. That is the funding side of the same story: buying rental assets consumes cash long before the rental income returns it, and the company reached for short-term debt to bridge the gap.
Net assets fell ¥626 million to ¥17,984 million. The arithmetic is straightforward and worth spelling out, because it explains the headline balance-sheet number: the quarter's ¥545 million of net profit was added, and ¥1,169 million of dividends were paid out — that being the prior year's ¥72.00 year-end dividend, an entire year's distribution settled inside a single three-month period. Owners' equity ended at ¥17,975 million and the equity ratio fell to 63.8% from 67.1%, down 3.3 points.
Read that fall for what it is rather than as a warning light. A ratio drops when the numerator grows more slowly than the denominator, and here equity shrank by design — the dividend is a deliberate return of capital — while assets grew because the company chose to put more rental equipment into the field with borrowed money. Both halves are the business working as intended. A 63.8% equity ratio still leaves an unusually wide cushion, and the same pattern should recur in the first quarter of most years, since the year-end dividend always settles here.
Guidance untouched, and a quarter running ahead of it
Japan Care Supply left its FY3/2027 forecast exactly as issued with its full-year results on May 12, 2026: revenue of ¥37,500 million, up 7.4%; operating profit of ¥3,450 million, up 11.5%; ordinary profit of ¥3,450 million, up 10.5%; and net profit attributable to owners of parent of ¥2,300 million, up just 1.9%, for EPS of ¥148.00. The company says trading through the first quarter has been on plan and that it assumes no major change in the business environment.
Against those targets the quarter lands at roughly a straight-line pace — revenue at 24.5% of the full-year figure, operating profit at 23.6%, ordinary profit at 24.0% and net profit at 23.7%. But the growth rates tell a different story from the ratios. Operating profit grew 18.3% against a full-year plan that calls for 11.5%, and net profit grew 17.3% against a plan that calls for 1.9%. Strip the quarter out and the guidance implies the remaining nine months deliver operating profit of ¥2,636 million, up about 9.5% year on year, but net profit of only ¥1,755 million — around 2% below the same nine months last year. The company is guiding for its own operating momentum to slow, and for something below the operating line, most plausibly a prior-year tax or non-operating base effect, to weigh on the net line for the rest of the year.
On shareholder returns, the FY3/2027 dividend forecast is ¥74.00 per share, all of it at the year-end with nothing at the interim, against ¥72.00 paid for FY3/2026 — and it too is unrevised. Set against forecast EPS of ¥148.00, that is a payout ratio of exactly 50%, a level the company has held with visible deliberateness. The ¥1,169 million that left the balance sheet this quarter was the prior year's ¥72.00; the ¥74.00 will do the same a year from now.
| Metric | Q1 FY3/2027 | Q1 FY3/2026 | Change |
|---|---|---|---|
| Revenue (¥ million) | 9,193 | 8,499 | +8.2% |
| Gross profit (¥ million) | 3,361 | 3,075 | +9.3% |
| SG&A expenses (¥ million) | 2,547 | 2,387 | +6.7% |
| Operating profit (¥ million) | 814 | 687 | +18.3% |
| Operating margin | 8.9% | 8.1% | +0.8 pt |
| Ordinary profit (¥ million) | 827 | 698 | +18.3% |
| Net profit attrib. to owners of parent (¥ million) | 545 | 464 | +17.3% |
| Comprehensive income (¥ million) | 541 | 446 | +21.2% |
| EPS (¥) | 35.08 | 29.90 | +17.3% |
| Depreciation & amortisation (¥ million) | 1,874 | 1,791 | +4.6% |
| Total assets (¥ million; vs Mar 31, 2026) | 28,191 | 27,734 | +1.6% |
| Total liabilities (¥ million; vs Mar 31, 2026) | 10,207 | 9,123 | +11.9% |
| Short-term borrowings (¥ million; vs Mar 31, 2026) | 2,100 | 1,050 | +100.0% |
| Net assets (¥ million; vs Mar 31, 2026) | 17,984 | 18,611 | −3.4% |
| Equity ratio (vs Mar 31, 2026) | 63.8% | 67.1% | −3.3 pt |
| Operating locations (vs Mar 31, 2026) | 100 | — | Shiga opened, Kashiwa relocated |
| FY3/2027 guidance — revenue (¥ million) | 37,500 | — | +7.4% |
| FY3/2027 guidance — operating profit (¥ million) | 3,450 | — | +11.5% |
| FY3/2027 guidance — net profit (¥ million) | 2,300 | — | +1.9% |
| FY3/2027 dividend forecast (¥ per share) | 74.00 | 72.00 | +¥2.00 |
JapanStockPulse provides informational content only and does not constitute investment advice. Figures are taken from the company's published earnings short report and may be subject to subsequent revision.