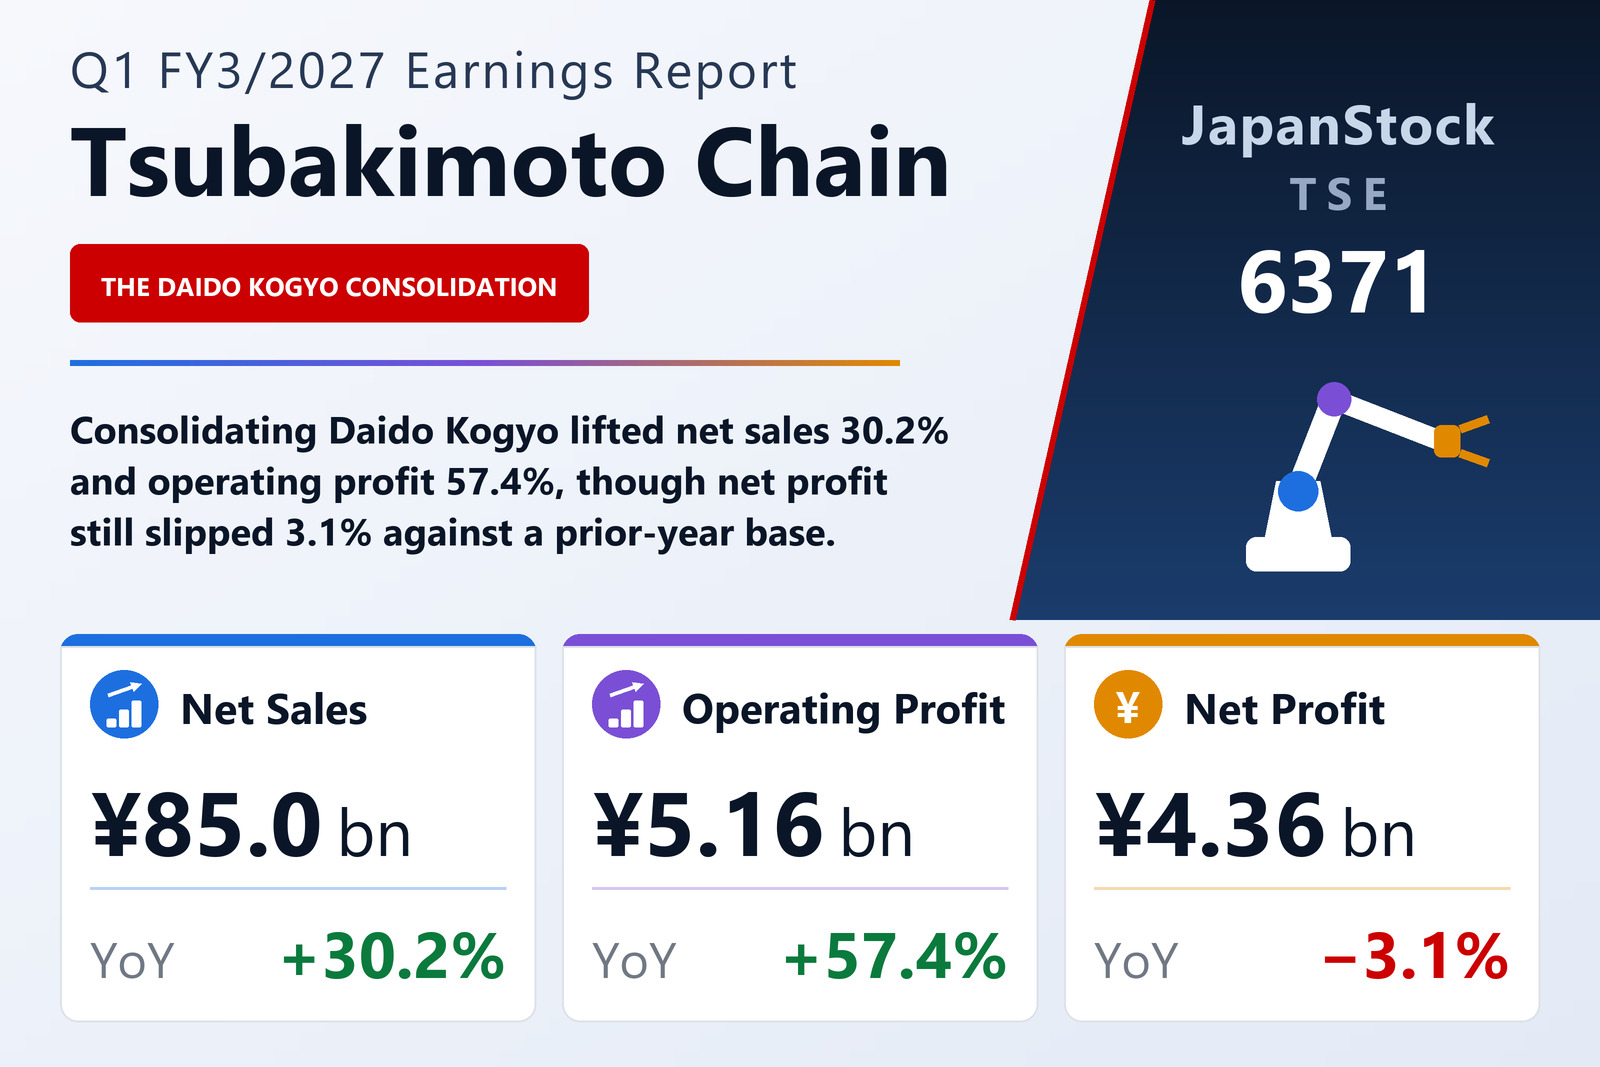
Tsubakimoto Chain Co. (TSE: 6371), the Osaka-based maker of industrial chains, power-transmission components and materials-handling systems, reported consolidated results for the first quarter of the fiscal year ending March 2027 — the three months from April 1 to June 30, 2026 — under Japanese GAAP. Net sales rose 30.2% to ¥85.05 billion, operating profit rose 57.4% to ¥5.16 billion and ordinary profit rose 60.0% to ¥6.97 billion. Net profit attributable to owners of the parent, however, fell 3.1% to ¥4.36 billion, because the year-earlier quarter contained a ¥1.83 billion gain on the sale of investment securities that did not repeat while this quarter carried a ¥906 million business-restructuring loss. Basic earnings per share were ¥42.20, down from ¥44.17; no diluted figure was reported. Orders received climbed 29.2% to ¥91.42 billion, a book-to-bill ratio of 1.07. The company also revised its reporting-segment structure from this quarter, so prior-year comparisons are made against restated figures.
Mobility swings the quarter as Daido Kogyo joins the group
The mobility segment was the single biggest source of the quarter's growth. Orders rose 47.1% to ¥33.03 billion, sales rose 48.5% to ¥33.21 billion and operating profit rose 54.1% to ¥3.23 billion, for a segment margin of 9.7%. Two things drove it: higher sales of automotive engine timing-chain systems at the group's Japanese and Indian Ocean Rim operations, and the consolidation of Daido Kogyo Co. as a subsidiary, which brought motorcycle components into the reported top line for the first time. Mobility now accounts for roughly 39% of group sales, essentially level with power transmission, whereas on the restated prior-year basis it was closer to a third — a structural shift in the sales mix rather than a cyclical one, and one that ties a larger share of group revenue to two-wheeler and engine demand.
Power transmission broadens; materials handling stays in the red
Power transmission, the group's traditional core, was the broadest gainer by geography. Orders rose 18.7% to ¥36.17 billion, sales rose 17.6% to ¥34.34 billion and operating profit rose 10.9% to ¥3.71 billion, with higher sales in Japan, the Americas, Europe, the Indian Ocean Rim and Korea/Taiwan. Because profit grew about half as fast as sales, the segment margin eased to 10.8%. Materials handling booked orders up 7.5% to ¥18.58 billion and sales up 10.0% to ¥14.46 billion on stronger sales of logistics-industry systems in Japan, but stayed loss-making: an operating loss of ¥730 million, wider than the ¥634 million loss a year earlier, as sales of metal-chip conveyance and coolant-treatment systems in the Americas declined. The order book is well ahead of billings here — ¥18.58 billion of orders against ¥14.46 billion of sales — which points to revenue recognition catching up later in the year. The "other" bucket grew off a very small base, with orders up 515.1% to ¥3.65 billion and sales up 406.3% to ¥3.04 billion against an operating loss of ¥587 million, versus a ¥179 million loss a year earlier. Summed, the four segments produced ¥5.62 billion of operating profit; ¥458 million of eliminations and unallocated corporate costs brought the consolidated figure back to ¥5.16 billion.
Below the operating line, a gain that did not repeat
Gross profit rose to ¥24.39 billion from ¥19.28 billion, but the gross margin narrowed to 28.7% from 29.5% as cost of sales grew slightly faster than revenue. Selling, general and administrative expenses of ¥19.22 billion, up from ¥16.00 billion, grew more slowly than sales, and that operating leverage is what widened the operating margin to 6.1% from 5.0%. Non-operating income of ¥2.21 billion, up from ¥1.30 billion, added more: dividend income of ¥1.10 billion, interest income of ¥425 million and a ¥336 million foreign-exchange gain where the year-earlier quarter recorded none, against non-operating expenses of ¥409 million versus ¥229 million. Below ordinary profit the direction reverses. A ¥906 million business-restructuring loss trimmed pre-tax profit to ¥6.06 billion, whereas a year earlier the ¥1.83 billion securities-sale gain had lifted pre-tax profit to ¥6.18 billion — so pre-tax profit actually fell 2.0% even as ordinary profit rose 60.0%. After ¥1.68 billion of tax and ¥22 million to non-controlling interests, net profit attributable to owners was ¥4.36 billion. EPS fell 4.5%, more than the 3.1% profit decline, because the average share count rose to 103.23 million from 101.81 million. Comprehensive income was ¥10.68 billion against just ¥41 million a year earlier, when a ¥3.85 billion negative currency-translation swing had erased almost all of it; this quarter translation adjustments added ¥1.85 billion and marks on available-for-sale securities ¥4.53 billion.
A buyback trims the equity ratio even as securities marks lift the balance sheet
Total assets stood at ¥465.49 billion at June 30, up ¥5.71 billion from ¥459.78 billion at the March 2026 year-end. Investment securities rose ¥4.47 billion on higher market values of held shares, inventories rose ¥3.75 billion — mostly work in process — and construction in progress rose ¥1.40 billion, while notes and accounts receivable including contract assets fell ¥3.44 billion and other current assets fell ¥694 million. Liabilities rose ¥5.15 billion to ¥161.12 billion, as borrowings increased ¥5.22 billion and other current liabilities ¥3.41 billion while the bonus provision fell ¥2.95 billion. Net assets rose only ¥558 million to ¥304.37 billion: a ¥4.52 billion increase in the valuation difference on available-for-sale securities, a ¥1.83 billion increase in the foreign-currency translation adjustment and a ¥519 million increase in non-controlling interests were largely offset by a ¥6.20 billion increase in treasury stock from share repurchases, which reduces equity. Treasury shares outstanding more than doubled to 4,580,943 from 2,181,787. Shareholders' equity was therefore almost flat at ¥296.40 billion against ¥296.36 billion, and because assets grew while equity did not, the equity ratio slipped 0.8 point to 63.7% from 64.5%.
Guidance and the ¥80 dividend left unchanged
Tsubakimoto left both its half-year and full-year forecasts exactly as published on May 13, 2026. The first-half plan calls for net sales of ¥170.00 billion (+25.3%), operating profit of ¥10.70 billion (+28.9%), ordinary profit of ¥12.00 billion (+18.6%), net profit of ¥10.00 billion (+0.8%) and EPS of ¥98.10. The full-year plan is net sales of ¥350.00 billion (+18.3%), operating profit of ¥25.50 billion (+18.2%), ordinary profit of ¥26.00 billion (+4.8%), net profit of ¥22.00 billion (−25.9%) and EPS of ¥218.17 — the forecast net-profit decline reflects one-off gains booked in the year just ended rather than weaker operations. Against those numbers the first quarter delivered 24.3% of the full-year sales plan and a full 50.0% of the half-year plan, but only 20.2% of the full-year operating-profit plan and 48.3% of the half-year figure, so profit is running slightly behind the sales pace; ordinary profit, at 26.8% of the full-year plan, is comfortably ahead. The dividend forecast is likewise unchanged: ¥40.00 at the half-year and ¥40.00 at the year-end for an annual ¥80.00, the same total paid for the year ended March 2026. Separately, the company began its Medium-Term Management Plan 2030 this fiscal year as the second phase of its Long-Term Vision 2030, aimed at shifting toward a more profitable business structure, strengthening global group governance and managing with the cost of capital in view. Supplementary explanatory material was prepared, no results briefing was held, and the quarterly consolidated financial statements were not subject to review by a certified public accountant or auditing firm.
| Metric | Q1 FY3/2027 | Q1 FY3/2026 | YoY |
|---|---|---|---|
| Net sales (¥ million) | 85,050 | 65,317 | +30.2% |
| Operating profit (¥ million) | 5,163 | 3,280 | +57.4% |
| Operating margin (%) | 6.1 | 5.0 | +1.1 pt |
| Ordinary profit (¥ million) | 6,965 | 4,354 | +60.0% |
| Net profit attributable to owners (¥ million) | 4,356 | 4,496 | −3.1% |
| Basic EPS (¥) | 42.20 | 44.17 | −4.5% |
| Comprehensive income (¥ million) | 10,677 | 41 | ×260 |
| Orders received (¥ million) | 91,422 | — | +29.2% |
| Total assets (¥ million, vs FY3/26 year-end) | 465,494 | 459,784 | +1.2% |
| Equity ratio (%, vs FY3/26 year-end) | 63.7 | 64.5 | −0.8 pt |
| FY3/27 net sales plan (¥ million) | 350,000 | — | +18.3% |
| FY3/27 operating profit plan (¥ million) | 25,500 | — | +18.2% |
| FY3/27 net profit plan (¥ million) | 22,000 | — | −25.9% |
| Annual dividend (¥, FY3/27 forecast vs FY3/26 actual) | 80.00 | 80.00 | unchanged |
JapanStockPulse provides informational content only and does not constitute investment advice. Figures are taken from the company's published earnings short report and may be subject to subsequent revision.