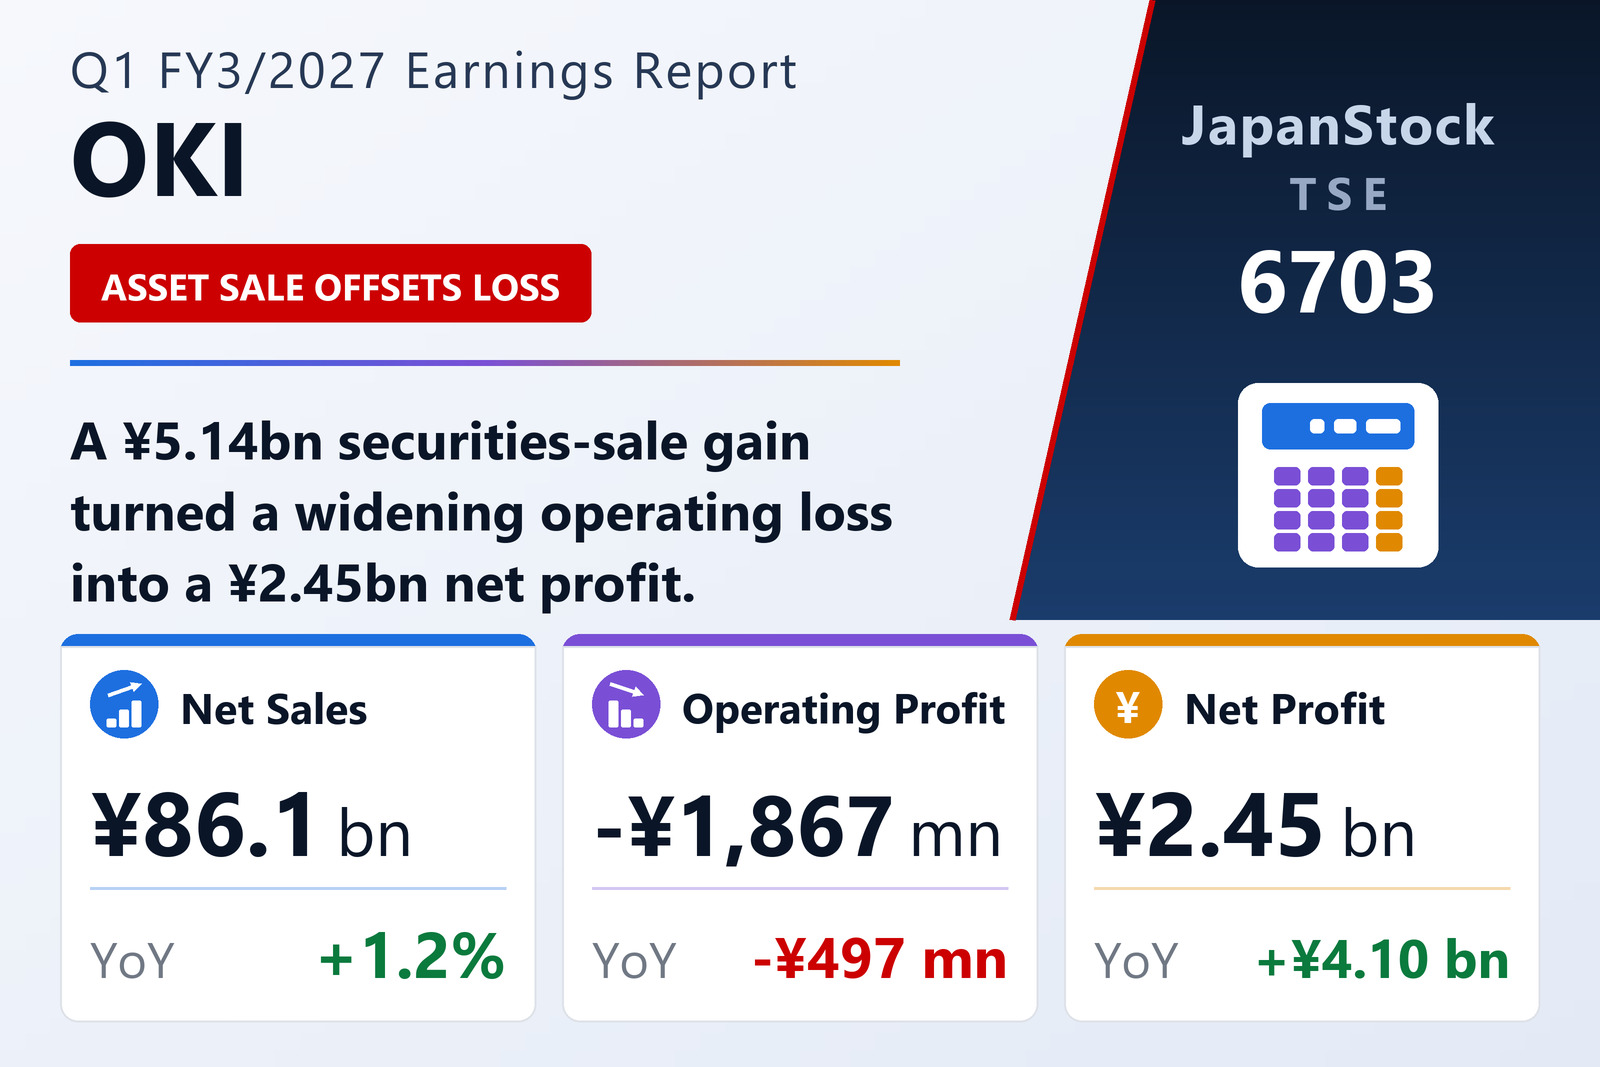
Oki Electric Industry Co., Ltd. (TSE: 6703) — the Tokyo-based maker of ATMs and financial terminals, network infrastructure, defence-related systems and electronic components — reported consolidated results for the first quarter of the year to March 2027, the three months from April 1 to June 30, 2026, under Japanese GAAP. Net sales rose 1.2% to ¥86,138 million from ¥85,077 million, but the operating loss widened to ¥1,867 million from ¥1,370 million a year earlier. The ordinary loss was little changed at ¥1,525 million against ¥1,563 million. Below that line the picture reverses: profit attributable to owners of the parent came in at a positive ¥2,453 million, against a loss of ¥1,643 million in the same quarter of 2025. Basic earnings per share were ¥28.28, versus a loss per share of ¥18.95.
What produced the net profit: a ¥5.14 billion securities sale
The gap between a deteriorating operating result and a roughly ¥4.1 billion swing at the bottom line is explained almost entirely by one line item. OKI booked extraordinary income of ¥5,142 million, consisting solely of a gain on the sale of investment securities; there was no extraordinary income at all in the year-ago quarter. That gain carried pre-tax profit to ¥3,617 million, from a pre-tax loss of ¥1,563 million. Income taxes of ¥1,157 million — current tax of ¥813 million plus a ¥343 million deferred charge, against just ¥74 million a year earlier — left quarterly net profit of ¥2,459 million, of which ¥6 million was attributable to non-controlling interests. Management stated plainly that the sharp improvement in net profit came from gains on the sale of investment securities. The cash flow statement shows the size of the disposal: proceeds from the sale of investment securities were ¥13,429 million in the quarter.
Two smaller effects worked in the same direction. Non-operating expenses fell to ¥1,166 million from ¥1,482 million as a ¥492 million foreign-exchange gain replaced a ¥459 million exchange loss, while non-operating income rose to ¥1,508 million from ¥1,289 million. The offset appears one statement further on: comprehensive income was negative ¥2,891 million against negative ¥1,359 million, because realising the gain recycled ¥3,767 million of previously unrealised valuation differences on securities out of other comprehensive income, alongside a ¥1,441 million negative retirement-benefit adjustment.
Three new segments, and a defence-led lift at Public Solutions
OKI reorganised its reportable segments this quarter into three — Public Solutions, Financial Solutions and Components & Manufacturing, plus an "Other" category — and restated the prior-year figures on the new basis. Public Solutions was the standout: external sales rose 22.3% to ¥28,172 million and segment profit jumped 491.3% to ¥1,119 million from ¥189 million, on growth in the defence systems and network infrastructure businesses. The company said the unit is tracking well towards its annual target.
Financial Solutions moved the other way, with external sales down 12.9% to ¥27,399 million and segment profit down 85.5% to ¥230 million from ¥1,591 million, hit by lower volumes and a margin squeeze from a changed product mix — although it stayed in the black. Components & Manufacturing lifted external sales 2.2% to ¥29,854 million but its segment loss widened slightly to ¥571 million from ¥518 million; printed circuit boards and cables within the advanced components business grew both sales and profit, and OKI said preparations for mass production of Crystal Film Bonding (CFB) are progressing to plan. "Other" contributed ¥711 million of external sales, down 47.3%, narrowing its segment loss to ¥11 million from ¥247 million. Aggregate segment profit of ¥767 million was turned into the consolidated operating loss by ¥2,634 million of eliminations and unallocated corporate costs — chiefly group-level administrative and R&D expense, which rose to ¥2,802 million from ¥2,336 million.
Full-year guidance untouched — and all of it has to come later
OKI left the full-year forecast it first published on May 13, 2026 entirely unchanged: net sales of ¥440,000 million (+4.4%), operating profit of ¥22,000 million (+16.7%), ordinary profit of ¥22,000 million (+5.9%) and profit attributable to owners of the parent of ¥18,000 million (−16.3%), with EPS of ¥207.52.
The shape of that forecast deserves a moment. With the first quarter delivering an operating loss of ¥1,867 million, the whole ¥22,000 million of guided full-year operating profit — closer to ¥23.9 billion once the first-quarter loss is made good — has to be earned in the remaining nine months. Management described the quarter as broadly in line with plan and said sales and operating profit had started roughly as expected, which is consistent with an earnings profile weighted heavily towards the back half of the year: OKI's public-sector and financial-terminal deliveries traditionally cluster around the March fiscal year-end, leaving the April–June quarter carrying fixed costs against thin volume. The company said it would report promptly if exchange rates or market conditions produced a material divergence from the plan. Note too that guided net profit falls 16.3% even as operating profit rises 16.7% — an implied step down in below-the-line gains from the unusually large contribution booked in the year just ended.
Balance sheet and cash flow
Total assets fell ¥30.3 billion from the March 31, 2026 year-end to ¥414,919 million, mainly because notes and accounts receivable and contract assets dropped ¥38.1 billion, partly offset by a ¥12.6 billion build in inventories. Shareholders' equity declined ¥8.5 billion to ¥171,779 million: the ¥2,453 million quarterly profit was outweighed by a ¥5.4 billion fall in accumulated other comprehensive income and ¥5.6 billion of ordinary dividends paid. Even so the equity ratio improved to 41.4% from 40.5%, as the asset base shrank faster than equity. Interest-bearing borrowings fell ¥6.2 billion to ¥87.8 billion from ¥94.0 billion, and trade payables were down ¥6.4 billion.
Operating cash flow was an inflow of ¥13.4 billion, against ¥2.1 billion a year earlier, driven by the release of working capital. Investing activities produced an inflow of ¥7.3 billion — versus a ¥5.2 billion outflow last year — on the securities sale proceeds. Free cash flow was therefore a ¥20.7 billion inflow, against a ¥3.1 billion outflow a year ago. Financing used ¥12.4 billion, chiefly repayments of borrowings and lease obligations. Cash and equivalents ended the quarter at ¥44,420 million, up from ¥35,786 million at the start of the year.
Dividend held at ¥65.00
The dividend forecast was left unchanged as well. For the year ended March 2026 OKI paid no interim dividend and a ¥65.00 year-end dividend, an annual total of ¥65.00. For FY3/2027 it again guides no interim payment and a ¥65.00 year-end dividend, an unchanged ¥65.00 for the full year — a payout of roughly 31% against guided EPS of ¥207.52. The results were released alongside a management briefing for institutional investors held the same day, and sit within the six-year "Management Plan 2031" the company launched this fiscal year ahead of its 150th anniversary.
| Metric | Q1 FY3/2027 | Q1 FY3/2026 | YoY |
|---|---|---|---|
| Net sales (¥ billion) | 86.14 | 85.08 | +1.2% |
| Gross profit (¥ billion) | 18.33 | 19.95 | −8.2% |
| SG&A expenses (¥ billion) | 20.19 | 21.32 | −5.3% |
| Operating profit / (loss) (¥ billion) | −1.87 | −1.37 | — |
| Ordinary profit / (loss) (¥ billion) | −1.53 | −1.56 | — |
| Extraordinary income — securities sale gain (¥ billion) | 5.14 | 0.00 | — |
| Pre-tax profit / (loss) (¥ billion) | 3.62 | −1.56 | — |
| Profit attrib. to owners of parent (¥ billion) | 2.45 | −1.64 | — |
| Basic EPS (¥) | 28.28 | −18.95 | — |
| Comprehensive income (¥ billion) | −2.89 | −1.36 | — |
JapanStockPulse provides informational content only and does not constitute investment advice. Figures are taken from the company's published earnings short report and may be subject to subsequent revision.