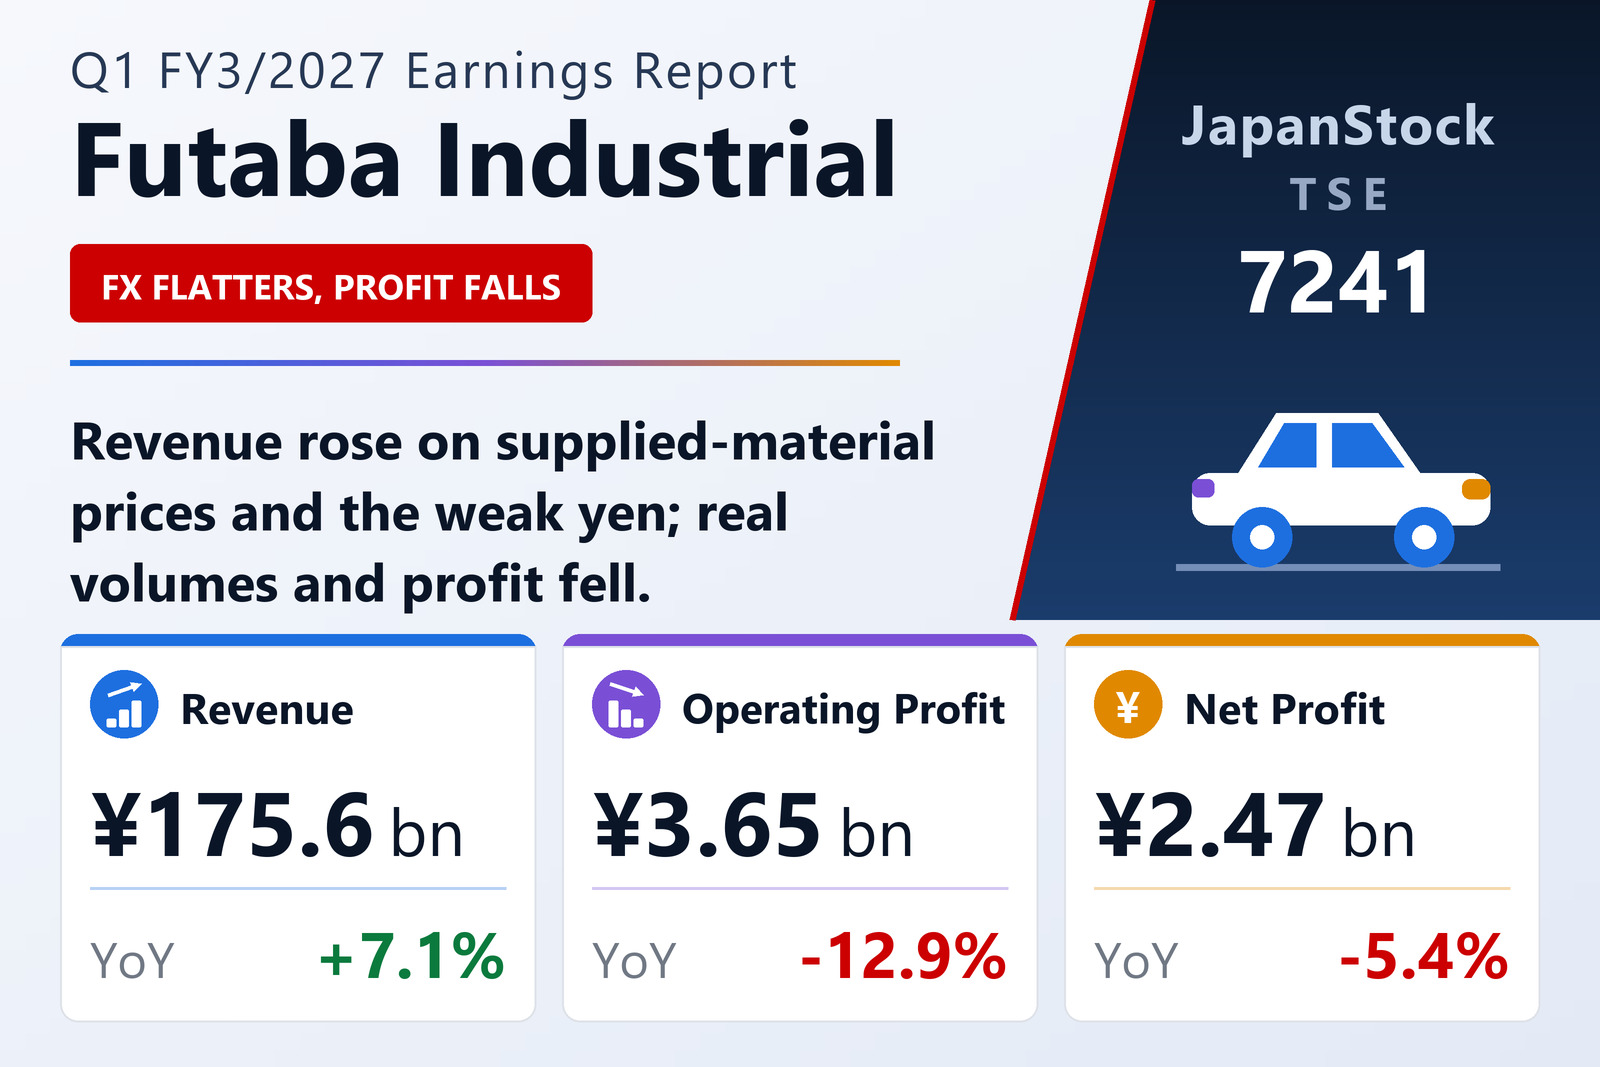
Revenue up 7.1%, operating profit down 12.9% — and it is one story, not two
Futaba Industrial Co., Ltd. (TSE and Nagoya: 7241), the Aichi-based maker of automotive body and exhaust components and one of the Toyota group's long-standing suppliers, disclosed consolidated first-quarter results for the fiscal year ending March 2027 — April 1 to June 30, 2026 — under Japanese GAAP on July 30, 2026. Revenue rose 7.1% to ¥175,614 million from ¥163,920 million, reversing the 12.1% decline recorded in the same quarter a year earlier. Operating profit went the other way, falling 12.9% to ¥3,649 million from ¥4,191 million, which had itself been up 16.0%.
Below that, the lines diverge again. Ordinary profit rose 3.4% to ¥4,102 million from ¥3,969 million, while net profit attributable to owners of parent fell 5.4% to ¥2,474 million from ¥2,614 million. Earnings per share were ¥27.71 against ¥29.22, with the diluted figure identical. Comprehensive income rose 40.9% to ¥2,661 million from ¥1,888 million, which had been down 61.7%.
The reason revenue and operating profit point in opposite directions is that they are measuring different things. Futaba reports its top line on two bases, and the gap between them is the whole quarter. Revenue including customer-supplied materials — the headline figure — added ¥11,693 million year on year. Revenue excluding them rose only ¥2,021 million, or 1.8%, to ¥111,399 million from ¥109,377 million. And once movements in material benchmark prices and in currency are stripped out as well, what the company calls real revenue fell about ¥3.5 billion, or 3.2%.
Supplied materials — shikyūhin — are components such as catalysts that Futaba buys from its own customers on a paid-supply basis. Their cost is embedded in the selling price of the finished part, so they inflate revenue and cost of sales by the same amount and contribute nothing to profit. Material benchmark pricing behaves identically: when market prices move, the purchase cost and the material element of the selling price move together. Currency was the third lever, and a large one — the average rate used in the quarter was ¥159.5 to the dollar against ¥144.6 a year earlier, a yen weaker by 10.3%. Once all three are removed, what is left is a business whose volumes shrank, which is exactly what the operating line reports.
The profit bridge, and what depreciation is doing to it
Futaba publishes an operating-profit bridge, and it reconciles cleanly to the ¥542 million decline. On the credit side, price pass-through to customers added ¥1.3 billion and rationalisation and improvement work added ¥0.6 billion — ¥1.9 billion of gains. Against them: higher depreciation cost ¥1.0 billion, selling-price variation ¥0.6 billion, lost profit on lower parts-business revenue ¥0.4 billion, higher material, labour and other expenses ¥0.3 billion, and lower profit outside the parts business ¥0.1 billion — ¥2.4 billion of drags. The net is a ¥0.5 billion fall.
Depreciation is the largest single item on that list, and it is the consequence of a decision rather than an accident. Depreciation and amortisation rose 20.0% to ¥6,416 million from ¥5,346 million, while capital expenditure on an inspection-completed basis fell 21.7% to ¥4,953 million from ¥6,323 million. That is the signature of a company that spent heavily in earlier periods and is now carrying the charge — and the charge has further to run, because the full-year plan puts capital expenditure at ¥37.0 billion and depreciation at ¥27.0 billion, both above the quarterly run rate implied here.
It is worth being precise about what that means for the medium-term target. Futaba measures its operating margin against revenue excluding supplied materials, and on that basis the quarter came in at 3.3%, down from 3.8% a year earlier. The full-year plan implies 4.3%. The 2027 goal is 5.0%. The first quarter therefore moved away from the target, not towards it — and it did so with the investment cycle still in front of the company rather than behind it.
Below the operating line: an FX gain lifts ordinary profit, tax takes it back
Ordinary profit rose even though operating profit fell because non-operating items swung by more than the operating decline. This quarter they contributed a net ¥453 million — interest and dividend income, equity-method investment income and a foreign-exchange gain — against a net expense of ¥222 million a year earlier, when the currency line was a loss. That ¥675 million swing more than covered the ¥542 million fall at the operating line, which is how a 12.9% decline becomes a 3.4% increase one line down.
Net profit nonetheless fell 5.4%, and the reason is tax. Income taxes rose 22.0% to ¥1,515 million from ¥1,242 million, an effective rate of 36.9% against 31.3%. Profit before non-controlling interests was ¥2,587 million against ¥2,726 million, of which ¥113 million was attributable to non-controlling interests. Futaba applies the accounting treatment specific to quarterly consolidated statements for tax, estimating the effective rate for the full year after tax-effect accounting and applying it to quarterly pre-tax profit; it also applies paragraph 7 of Practical Solution No. 46, so no global minimum tax has been recognised. The quarterly consolidated statements were not reviewed by an accounting auditor.
Comprehensive income is the one measure that improved sharply, up 40.9% to ¥2,661 million, and the swing sits almost entirely in the foreign-currency translation adjustment — positive ¥959 million this year against negative ¥168 million last year. The weak yen that inflated revenue without helping profit did unambiguously lift the translated value of the group's overseas net assets. Against that, unrealised losses on securities were ¥763 million and retirement-benefit remeasurement a negative ¥177 million. Of the total, ¥2,414 million was attributable to owners of parent and ¥246 million to non-controlling interests.
Five regions, two entirely different pictures
Japan is the one region where the headline and the underlying business agree. Revenue including inter-segment sales rose 3.7% to ¥80,495 million on higher vehicle production at customers, and segment profit rose 1.9% to ¥1,542 million. On the ex-supplied-materials basis revenue was ¥53,860 million, up 6.7%, at a margin of 2.9% against 3.0% — the group's thinnest.
North America and Europe show the pattern the group describes in its own commentary: currency lifted revenue while the real business shrank, so profit fell. North American revenue rose 9.8% to ¥49,585 million but segment profit fell 4.0% to ¥1,294 million, the margin slipping to 3.5% from 3.9%. Europe was the sharper case — revenue up 17.4% to ¥18,240 million, segment profit down 37.6% to ¥376 million, and the margin more than halved, to 3.6% from 6.2%.
China is the only outright decline and the only loss. Revenue fell 34.0% to ¥10,357 million as customer vehicle production dropped, and the region posted a segment loss of ¥39 million against a ¥453 million profit a year earlier. Excluding supplied materials the fall was 32.8%, to ¥8,338 million — so this is a genuine volume collapse, not a reporting artefact, and the margin went from 3.7% to negative 0.5%.
Asia is the headline of the quarter and also its best illustration of why headlines mislead here. Revenue rose 66.7% to ¥20,467 million and segment profit rose 69.7% to ¥490 million, at a margin of 10.5% — three times the group average and by some distance its most profitable region. But excluding supplied materials, Asian revenue was ¥4,688 million, up only 4.8%. Nearly all of that two-thirds gain is material passing through the books.
The customer mix explains where the movement came from. Sales to the Toyota group were essentially flat at ¥135.8 billion, up 0.2%, but their share of revenue fell to 77.4% from 82.7% as others grew around them: Suzuki rose 55.3% to ¥20.0 billion, Mitsubishi Motors 66.9% to ¥7.1 billion, the Nissan group 14.2% to ¥2.8 billion and other customers 16.6% to ¥8.0 billion, while Honda slipped 4.8% to ¥1.6 billion. By product, the two bases diverge again: exhaust and fuel systems are 48.7% of revenue including supplied materials but only 28.8% excluding them, while body and interior components are 42.5% including but 58.8% excluding. Measured by what Futaba actually adds, this is a body-components company more than an exhaust one.
Revenue guidance lifted, profit guidance untouched, dividend raised to ¥45
Futaba revised its FY3/2027 forecast on the day of the release, but only on one line. Revenue was raised 3.1% to ¥690,000 million from the ¥669,000 million published on April 27, 2026. Operating profit of ¥19,000 million, ordinary profit of ¥19,000 million and net profit attributable to owners of parent of ¥14,000 million were all left exactly as forecast. Against FY3/2026 actuals — revenue ¥677,919 million, operating profit ¥18,715 million, ordinary profit ¥20,840 million and net profit ¥16,026 million — the guidance is revenue up 1.8%, operating profit up 1.5%, ordinary profit down 8.8% and net profit down 12.6%, on forecast EPS of ¥156.65 against ¥179.33 delivered last year. Raising the revenue line while holding profit flat is, in effect, the company saying that the extra revenue is the pass-through kind.
Against those targets the quarter runs slightly behind on profit and ahead on revenue: ¥3,649 million of operating profit is 19.2% of the ¥19,000 million full-year figure and ¥2,474 million of net profit only 17.7% of the ¥14,000 million target, while revenue is already 25.5% of the year. By region, the revised full-year plan for revenue excluding supplied materials is Japan ¥224,000 million, North America ¥144,000 million, Europe ¥40,000 million, China ¥34,000 million and Asia ¥20,000 million, netting to ¥446,000 million after ¥16,000 million of eliminations, with segment operating profit of ¥9,000 million, ¥6,200 million, ¥1,600 million, ¥600 million and ¥1,600 million respectively. China is guided back to a ¥600 million profit after a first-quarter loss, which is the plan's most demanding assumption.
Two items sit outside the numbers. The scope of consolidation changed for the first time in the period with the addition of FUTABA MANUFACTURING MAHARASHTRA PRIVATE LIMITED, a new Indian subsidiary and the concrete expression of the India expansion that sits among the company's five stated priorities. And the guidance explicitly excludes any effect from the earthquake that struck the Kumamoto region on July 28, two days before the release: the company says it is still investigating, cannot yet form a reasonable estimate, and will revise the forecast and disclose promptly if one becomes possible.
The balance sheet moved very little. Total assets stood at ¥335,596 million at June 30, up ¥1,264 million from ¥334,332 million at March 31, mainly on cash and deposits of ¥24,547 million against ¥21,384 million. Total liabilities rose ¥656 million to ¥189,137 million on higher accrued expenses, and net assets rose ¥607 million to ¥146,458 million on retained earnings. Owners' equity was ¥139,245 million against ¥138,885 million, leaving the equity ratio unchanged at 41.5%. Shares issued were 89,580,827 with 277,956 held in treasury, for a weighted average of 89,302,968 over the quarter against 89,489,614 a year earlier.
On returns, the FY3/2027 dividend forecast is ¥45.00 per share — an interim of ¥22.00, raised from ¥20.00, plus a year-end of ¥23.00 — against ¥43.00 for FY3/2026, and unrevised from the previous announcement. Against forecast EPS of ¥156.65 that is a payout ratio of about 28.7%, up from 24.0%. All of it sits inside a medium-term plan covering fiscal 2025 to 2027 that targets a 5.0% operating margin on revenue excluding supplied materials and ROE of 10% or more by fiscal 2027, and that the company frames explicitly as an investment period aimed at stable global growth by 2030. The five priorities are growth strategy — development and capacity for body components, new systems for exhaust components suited to electrification, accelerating new businesses to commercialisation, and expanding sites and strengthening the base in India — earnings power, human capital, carbon neutrality (a cut of more than 50% in global factory CO2 emissions by fiscal 2030 against fiscal 2019, and a challenge to reach carbon neutrality in Japan by 2030), and a financial and capital strategy conscious of the cost of capital and the share price with the aim of lifting PBR.
| Metric | Q1 FY3/2027 | Q1 FY3/2026 | Change |
|---|---|---|---|
| Revenue (¥ million) | 175,614 | 163,920 | +7.1% |
| Revenue excl. supplied materials (¥ million) | 111,399 | 109,377 | +1.8% |
| Operating profit (¥ million) | 3,649 | 4,191 | −12.9% |
| Operating margin (excl. supplied materials) | 3.3% | 3.8% | −0.5 pt |
| Ordinary profit (¥ million) | 4,102 | 3,969 | +3.4% |
| Net profit attrib. to owners of parent (¥ million) | 2,474 | 2,614 | −5.4% |
| Comprehensive income (¥ million) | 2,661 | 1,888 | +40.9% |
| EPS (¥) | 27.71 | 29.22 | −¥1.51 |
| Income taxes (¥ million) | 1,515 | 1,242 | +22.0% |
| Depreciation and amortisation (¥ million) | 6,416 | 5,346 | +20.0% |
| Capital expenditure (¥ million) | 4,953 | 6,323 | −21.7% |
| Japan segment revenue (¥ million) | 80,495 | 77,597 | +3.7% |
| Japan segment profit (¥ million) | 1,542 | 1,513 | +1.9% |
| North America segment revenue (¥ million) | 49,585 | 45,169 | +9.8% |
| North America segment profit (¥ million) | 1,294 | 1,348 | −4.0% |
| Europe segment revenue (¥ million) | 18,240 | 15,539 | +17.4% |
| Europe segment profit (¥ million) | 376 | 602 | −37.6% |
| China segment revenue (¥ million) | 10,357 | 15,689 | −34.0% |
| China segment profit / loss (¥ million) | −39 | 453 | Swing to loss |
| Asia segment revenue (¥ million) | 20,467 | 12,280 | +66.7% |
| Asia segment profit (¥ million) | 490 | 288 | +69.7% |
| Average USD/JPY rate | 159.5 | 144.6 | Yen 10.3% weaker |
| Total assets (¥ million; vs Mar 31, 2026) | 335,596 | 334,332 | +0.4% |
| Net assets (¥ million; vs Mar 31, 2026) | 146,458 | 145,851 | +0.4% |
| Equity ratio (vs Mar 31, 2026) | 41.5% | 41.5% | Unchanged |
JapanStockPulse provides informational content only and does not constitute investment advice. Figures are taken from the company's published earnings short report and may be subject to subsequent revision.