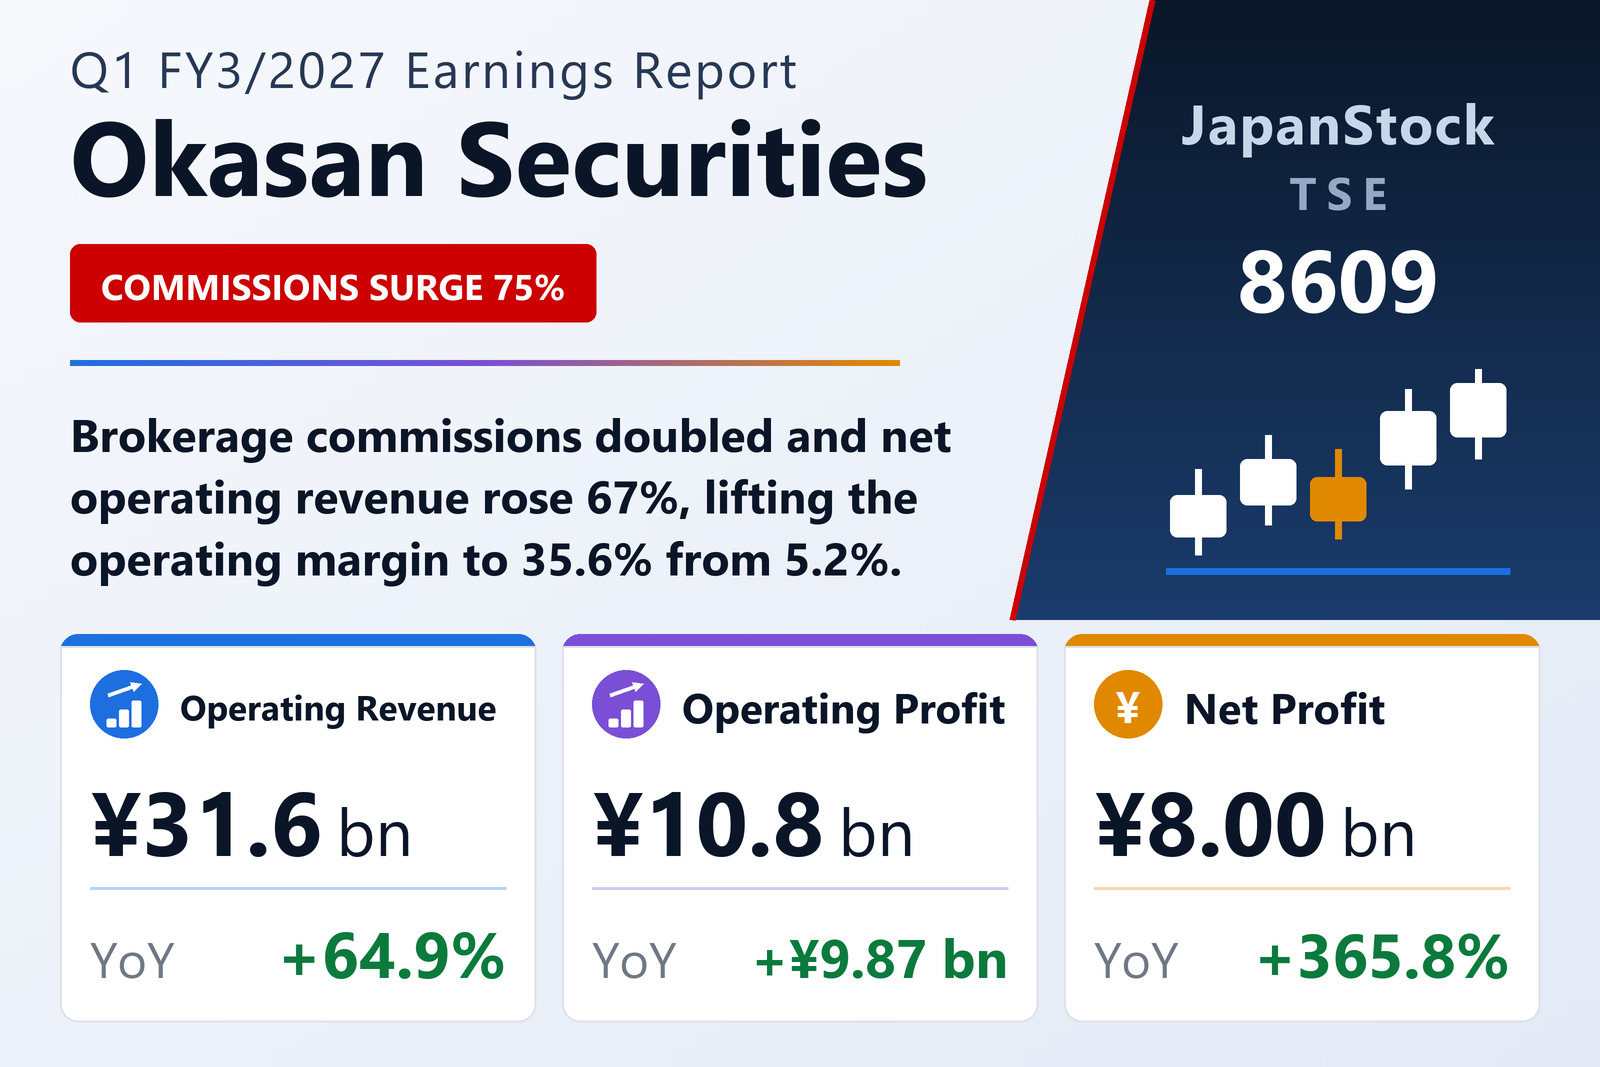
Okasan Securities Group Inc. (TSE: 8609; also listed in Nagoya), the holding company for Okasan Securities Co., Ltd. and a cluster of regional brokerage and platform businesses, reported consolidated results for the first quarter of the year to March 2027 — the three months from April 1 to June 30, 2026 — under Japanese GAAP. Operating revenue rose 64.9% to ¥31,570 million and net operating revenue rose 66.6% to ¥30,431 million. Operating profit came in at ¥10,823 million against ¥949 million a year earlier, an increase of more than eleven times. Ordinary profit rose 911.5% to ¥11,525 million and profit attributable to owners of the parent rose 365.8% to ¥8,001 million. Comprehensive income was ¥14,064 million against ¥588 million. Basic earnings per share were ¥39.97 versus ¥8.57, and diluted earnings per share ¥39.91 versus ¥8.55.
The comparison flatters the quarter in one respect: the year-earlier period was weak, with operating revenue then down 9.3% and operating profit down 76.0%. But the absolute numbers are the strongest the group has produced in the five quarters shown in its own quarterly trend table, and the operating profit of ¥10,823 million exceeds the ¥5,811 million booked in the whole of the preceding March quarter.
Where the 65% revenue jump came from
Commissions received are the engine. They climbed 75.4% to ¥21,808 million and now account for roughly 69% of operating revenue. Within that block, brokerage commissions doubled, up 100.6% to ¥11,336 million, with the equity component alone up 103.1% to ¥11,156 million. The market did much of the work: average daily trading volume in domestic common shares on the Tokyo Stock Exchange rose 28.9% to 3,855 million shares, while average daily turnover more than doubled, up 107.7% to ¥11.7882 trillion, as the Nikkei 225 briefly cleared a record 72,000 in June before closing the month at 70,062.32.
Investment trusts supplied the second leg. Subscription, secondary-distribution and related handling fees rose 65.2% to ¥5,125 million, with the company pointing to solid sales of funds investing in domestic equities, strong demand for a fund targeting quantum-technology companies, and inflows into principal-protection-oriented unit-type trusts. Other commissions received — largely trust fees on the accumulated investment-trust book — rose 56.5% to ¥4,906 million, a recurring-revenue line that grows with assets under custody rather than with trading activity.
The one weak spot was underwriting. Total underwriting, secondary-distribution and solicitation commissions fell 19.4% to ¥440 million. Equity underwriting fees jumped 152.1% to ¥142 million on an IPO lead-manager mandate, but bond underwriting fees fell 39.1% to ¥298 million against a year-earlier quarter that contained a large retail corporate-bond deal.
Trading swung, and financing was flat
Net trading income rose 63.9% to ¥6,818 million. Equity-related trading income rose 26.0% to ¥5,553 million, mostly from over-the-counter dealing in foreign — principally U.S. — shares for domestic clients. The bigger swing was in fixed income: bond-related trading turned to a ¥1,149 million profit from a ¥510 million loss a year earlier, as Japanese government bond positions moved from red to black. Other trading income fell 55.7% to ¥115 million.
The financing book was, by contrast, static. Financial revenue rose 12.1% to ¥2,383 million and financial expenses rose 29.5% to ¥1,139 million, leaving net financial income of ¥1,243 million, down 0.2%. Other operating revenue rose 32.1% to ¥560 million. In other words, essentially all of the improvement came from customer activity, not from carrying a larger balance sheet at a wider spread.
Costs rose 13% against a 67% revenue gain
Selling, general and administrative expenses rose 13.2% to ¥19,607 million. Personnel expenses were the largest line at ¥10,049 million, up from ¥8,594 million, and transaction-related costs rose to ¥3,363 million from ¥2,783 million — the two items the company itself identifies as the drivers. Almost everything else was flat or lower: office expenses ¥2,498 million (from ¥2,523 million), real-estate expenses ¥1,943 million (from ¥1,970 million), depreciation ¥858 million (from ¥772 million) and taxes and dues ¥528 million (from ¥312 million).
That is the whole story of the profit line. Net operating revenue grew by ¥12,166 million while SG&A grew by only ¥2,292 million, so close to ¥9.9 billion of the revenue increment fell straight through to operating profit. The margin on net operating revenue widened to 35.6% from 5.2%.
Why net profit grew "only" 366%
Below the operating line, non-operating income of ¥779 million and non-operating expenses of ¥77 million lifted the result to ordinary profit of ¥11,525 million. Extraordinary items then subtracted: gains of just ¥11 million against losses of ¥152 million, the latter business-transfer-related costs, for pre-tax profit of ¥11,384 million. Income taxes totalled ¥3,382 million, an effective rate of 29.7%.
The year-earlier quarter was structured very differently below the operating line. Extraordinary gains then were ¥983 million, of which ¥954 million was a one-off gain on the sale of investment securities, and the tax charge was only ¥298 million — an effective rate of 14.8%, helped by a ¥43 million credit for current income taxes. The prior-year net profit of ¥1,717 million was therefore flattered relative to its ¥949 million of operating profit. That is why net profit growth of 365.8% understates, rather than overstates, the operating improvement, and why ordinary profit growth of 911.5% is the cleaner comparison.
No forecast, and a dividend deliberately left undetermined
Okasan discloses no full-year earnings forecast for FY3/2027. Its stated reason is structural rather than tactical: the group's principal business is financial instruments dealing, results are directly exposed to swings in the market environment, and management regards forecasting under those conditions as impracticable. There is accordingly no guidance figure against which to measure this quarter, and none should be inferred from it.
The same logic carries into the dividend. Because there is no earnings forecast, the FY3/2027 dividend is undetermined — both the interim and the year-end payment. FY3/2026 paid ¥50.00 per share in total, all of it at the year-end (the interim was ¥0.00), split between a ¥40.00 ordinary dividend and a ¥10.00 special dividend. For the year-end payments of both FY3/2027 and FY3/2028 the company has fixed a ¥20.00 special dividend while leaving the ordinary component, and therefore the total, undetermined. There has been no revision to any previously announced dividend forecast — the figure is unset, not cut.
A balance sheet ¥166 billion larger in three months
Total assets rose ¥166,121 million from the March year-end to ¥1,567,212 million, or a little over ¥1.56 trillion. The increase came from securities collateral loans (up ¥59,119 million), trading products (up ¥54,469 million), cash and deposits (up ¥18,281 million) and deposits paid (up ¥13,487 million). Liabilities rose ¥162,060 million to ¥1,332,179 million, driven by trading products up ¥163,164 million and deposits received up ¥57,821 million, partly offset by declines in unsettled trade accounts (down ¥39,767 million), margin transaction liabilities (down ¥11,846 million) and securities collateral borrowings (down ¥10,516 million).
Net assets rose ¥4,060 million to ¥235,032 million, mainly on a ¥6,187 million increase in unrealised gains on other securities. Shareholders' equity was ¥234,909 million against ¥230,798 million, and book value per share ¥1,173.44 against ¥1,153.57. The equity ratio fell to 15.0% from 16.5% — arithmetic dilution from the balance-sheet growth rather than a deterioration, and unremarkable for a securities group whose assets are dominated by trading inventory and collateralised financing that is funded by matching liabilities. Shares issued were unchanged at 231,217,073, treasury shares rose to 31,144,327 from 31,027,861, and the weighted-average count used for per-share figures was 200,189,721 against 200,412,200 a year earlier.
One segment, one platform push, and an unreviewed statement
The group reports a single business segment, "Investment and Financial Services", and omits segment disclosure on materiality grounds, so there is no divisional breakdown to read. No cash-flow statement is prepared for the first quarter; depreciation, including amortisation of intangibles, was ¥858 million against ¥772 million. On the business side, the group extended its securities-platform offering to a regional bank for the first time, converted two subsidiaries of Securities Japan into financial instruments intermediary businesses, and launched a portfolio analysis service, "Okasan ARMS", at core subsidiary Okasan Securities as part of a push into fee-based asset management.
One procedural note: the quarterly consolidated financial statements attached to this release have not been reviewed by a certified public accountant or audit firm. The company plans to publish a reviewed version of the tanshin, with the review report attached, on August 5, 2026.
| Metric | Q1 FY3/2027 | Q1 FY3/2026 | YoY |
|---|---|---|---|
| Operating revenue (¥ million) | 31,570 | 19,145 | +64.9% |
| Net operating revenue (¥ million) | 30,431 | 18,265 | +66.6% |
| Commissions received (¥ million) | 21,808 | 12,436 | +75.4% |
| Brokerage commissions (¥ million) | 11,336 | 5,651 | +100.6% |
| Net trading income (¥ million) | 6,818 | 4,158 | +63.9% |
| SG&A expenses (¥ million) | 19,607 | 17,315 | +13.2% |
| Operating profit (¥ million) | 10,823 | 949 | — |
| Ordinary profit (¥ million) | 11,525 | 1,139 | +911.5% |
| Profit attrib. to owners of parent (¥ million) | 8,001 | 1,717 | +365.8% |
| Comprehensive income (¥ million) | 14,064 | 588 | — |
| Basic EPS (¥) | 39.97 | 8.57 | +366.4% |
| Diluted EPS (¥) | 39.91 | 8.55 | +366.8% |
Note: the company prints "—" rather than a percentage for the year-on-year change in operating profit and in comprehensive income, because both increases exceed 1,000%.
JapanStockPulse provides informational content only and does not constitute investment advice. Figures are taken from the company's published earnings short report and may be subject to subsequent revision.