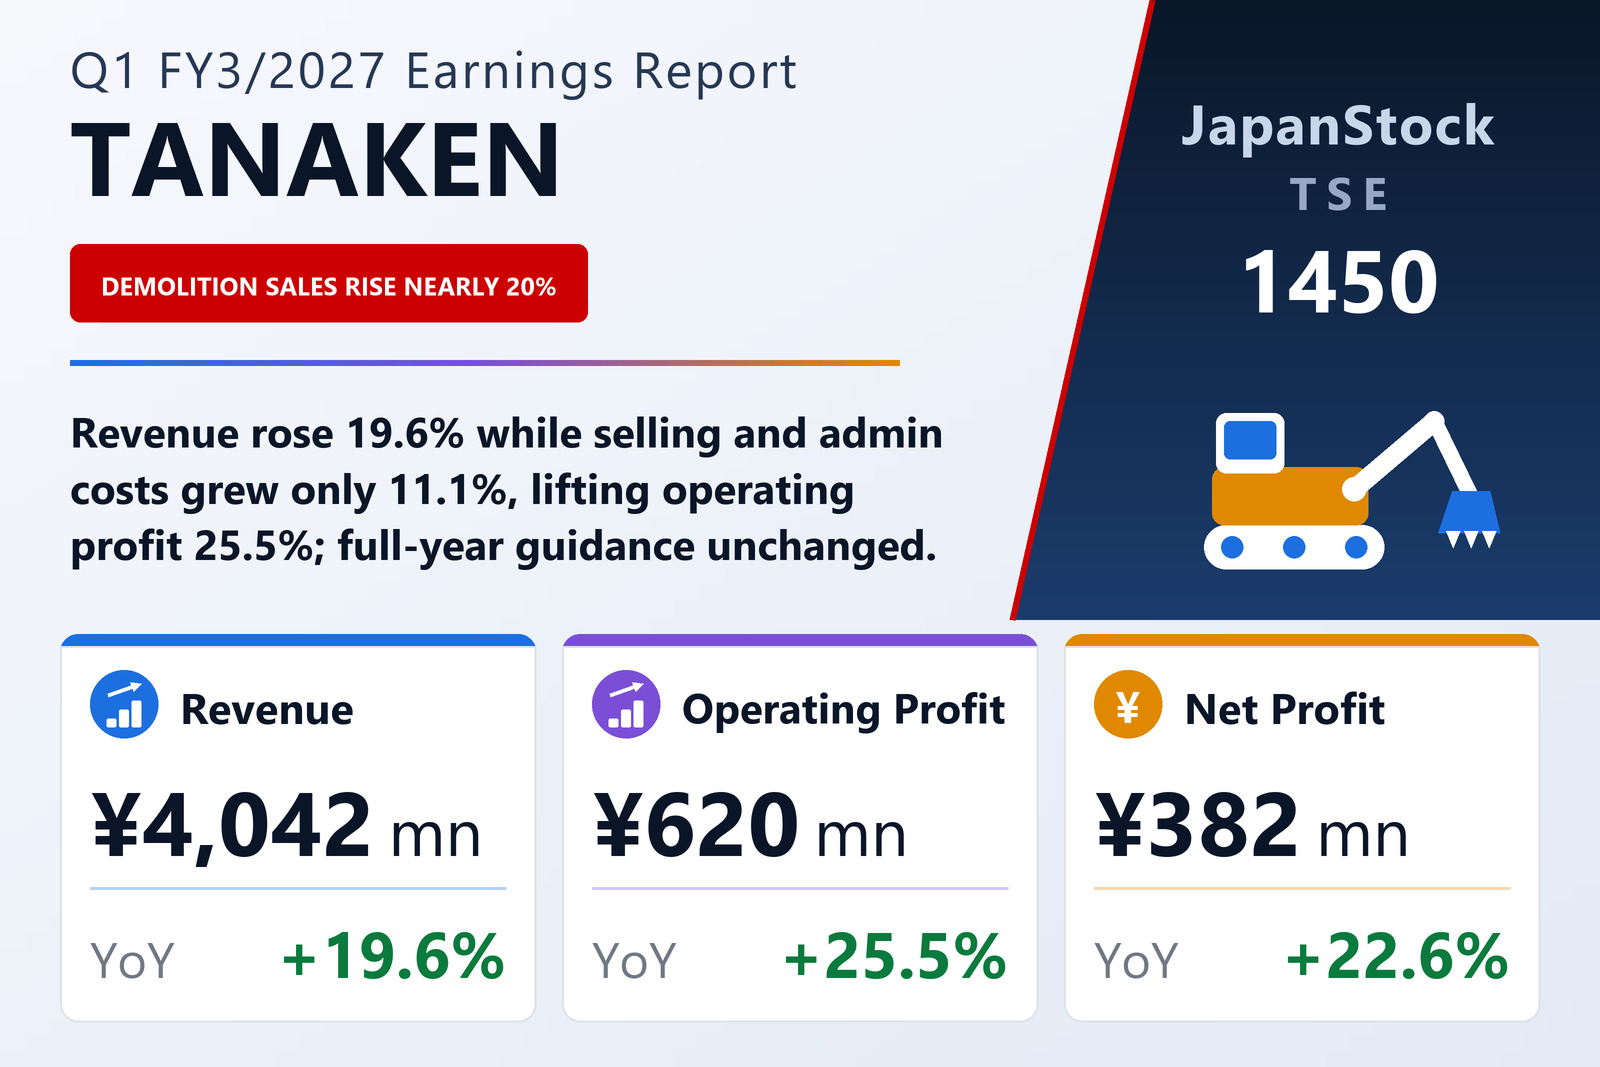
Revenue grew 19.6% and overheads 11.1% — that gap is most of the quarter
TANAKEN Inc. (TSE: 1450), a demolition contractor that reports a single demolition-business segment, published non-consolidated results for the first quarter of FY3/2027 — the three months from April 1 to June 30, 2026 — on July 31, 2026 under Japanese GAAP. Revenue rose 19.6% to ¥4,042 million, operating profit 25.5% to ¥620 million, ordinary profit 25.1% to ¥624 million and quarterly net profit 22.6% to ¥382 million, for earnings of ¥43.93 per share against ¥35.82. The company has no potentially dilutive shares, so no diluted figure is given, and the quarterly financial statements were not reviewed by an auditor.
Cost of sales rose 19.4% to ¥3,135 million, almost exactly in step with revenue, so gross profit rose 20.5% to ¥907 million and the gross margin barely moved, from 22.3% to 22.4%. The improvement came one line lower. Selling, general and administrative expenses grew only 11.1% to ¥287 million, falling from 7.7% of revenue to 7.1%, and that is what widened the operating margin from 14.6% to 15.3%. The filing does not break those expenses down, so it does not say how much of the spending it describes for the quarter — advertising, higher starting salaries and expanded training — sits in that line rather than in cost of sales.
Below the operating line, rental costs, new interest and a heavier tax charge trim the growth
Non-operating income rose to ¥10.3 million from ¥9.1 million, mostly rental income of ¥7.6 million and interest and dividends of ¥2.3 million. Non-operating expenses rose faster, to ¥5.8 million from ¥4.0 million, as the cost of rental income climbed to ¥5.3 million and interest expense of ¥462 thousand appeared where there had been none. Ordinary profit therefore grew 25.1%, a shade slower than operating profit. A loss of ¥322 thousand on the disposal of fixed assets took pre-tax profit to ¥624 million, up 25.0%.
Income taxes rose 29.1% to ¥242 million, lifting the effective tax rate from 37.6% to 38.8%, and that is why net profit, at ¥382 million, up 22.6%, grew more slowly than pre-tax profit. Earnings per share rose by the same 22.6%, since the average share count was essentially unchanged at 8,698,750.
Receivables rose ¥1,730 million, cash fell ¥863 million and ¥1,000 million was borrowed
Total assets rose 6.6% to ¥12,984 million from ¥12,178 million at March 31, 2026, and almost all of the change was working capital. Accounts receivable for completed construction rose by ¥1,730 million to ¥8,977 million, while cash and deposits fell by ¥863 million to ¥2,115 million. On the other side of the balance sheet, short-term borrowings of ¥1,000 million appeared where there had been none, taking current liabilities to ¥3,595 million from ¥2,695 million; advances received on uncompleted construction fell by ¥105 million and income taxes payable by ¥99 million. The filing sets out these movements but does not explain the borrowing.
Net assets fell 1.1% to ¥9,225 million. Retained earnings declined by ¥96 million because dividends paid in the quarter, ¥478 million, exceeded the quarter's ¥382 million net profit — a payment consistent with the ¥55.00 year-end dividend for FY3/2026 — and the valuation difference on securities fell by ¥3.7 million. With assets growing and equity shrinking, the equity ratio dropped from 76.6% to 71.1%. No cash-flow statement was prepared for the quarter; depreciation was ¥10.9 million against ¥12.6 million a year earlier.
The company points to ageing buildings, redevelopment and data centres
The filing describes the Japanese economy as continuing a moderate recovery on firm corporate earnings and improving employment and incomes, but with an uncertain outlook, citing US trade policy, geopolitical risk, rising energy and materials prices linked to the closure of the Strait of Hormuz, and supply constraints weighing on domestic production. For the construction industry it notes cost concerns from higher building-materials prices and a tight market for skilled construction workers. Demolition, it says, continues to enjoy a firm order environment, supported by the growing number of ageing buildings put up during Japan's period of rapid economic growth, urban redevelopment, more active condominium rebuilding and rising demand for logistics warehouses and data centres.
In April the company launched a new medium-term plan, TANAKEN “Vision NEXT 10” Secondary Phase, covering fiscal 2026 to 2028, which it positions as a growth strategy that follows the earlier three-year Primary Phase and further strengthens its operating base and construction capacity. Measures carried out in the quarter included active advertising, higher starting salaries, an expanded training programme and meetings with partner contractors to strengthen alliances, aimed at raising the value of the TANAKEN brand, strengthening its workforce and reinforcing safe construction. The filing gives no breakdown of revenue by project or customer, so it does not say which jobs drove the 19.6% increase.
Full-year guidance still calls for lower profit, and was not changed
TANAKEN left unchanged the FY3/2027 forecast it published on May 8, 2026: revenue of ¥16,000 million (+8.0%), operating profit of ¥2,100 million (−3.9%), ordinary profit of ¥2,100 million (−5.0%) and net profit of ¥1,400 million (−6.8%), for earnings per share of ¥160.94. The company does not publish a first-half forecast. After one quarter it has booked 25.3% of guided revenue, 29.5% of guided operating profit and 27.3% of guided net profit. The filing does not explain why it expects full-year profit to fall after a first quarter in which operating profit rose 25.5%, and it offers no comment on progress against the plan.
The dividend forecast was also unchanged: no interim dividend and a year-end dividend of ¥55.00, matching the annual ¥55.00 paid for FY3/2026. Against guided earnings per share of ¥160.94, that is a payout of about 34%.
| Metric | Q1 FY3/2027 | Q1 FY3/2026 | Change |
|---|---|---|---|
| Revenue (¥ million) | 4,042 | 3,379 | +19.6% |
| Gross profit (¥ million) | 907 | 752 | +20.5% |
| Gross margin | 22.4% | 22.3% | +0.1 pt |
| SG&A expenses (¥ million) | 287 | 258 | +11.1% |
| Operating profit (¥ million) | 620 | 494 | +25.5% |
| Operating margin | 15.3% | 14.6% | +0.7 pt |
| Ordinary profit (¥ million) | 624 | 499 | +25.1% |
| Pre-tax profit (¥ million) | 624 | 499 | +25.0% |
| Net profit (¥ million) | 382 | 311 | +22.6% |
| EPS (¥) | 43.93 | 35.82 | +22.6% |
| Total assets (¥ million) | 12,984 | 12,178 | +6.6% |
| Cash and deposits (¥ million) | 2,115 | 2,979 | −29.0% |
| Accounts receivable for completed construction (¥ million) | 8,977 | 7,246 | +23.9% |
| Short-term borrowings (¥ million) | 1,000 | 0 | new |
| Net assets (¥ million) | 9,225 | 9,325 | −1.1% |
| Equity ratio | 71.1% | 76.6% | −5.5 pt |
| FY3/2027 guidance — revenue (¥ million) | 16,000 | — | +8.0% |
| FY3/2027 guidance — operating profit (¥ million) | 2,100 | — | −3.9% |
| FY3/2027 guidance — ordinary profit (¥ million) | 2,100 | — | −5.0% |
| FY3/2027 guidance — net profit (¥ million) | 1,400 | — | −6.8% |
| FY3/2027 guidance — EPS (¥) | 160.94 | — | — |
| Annual dividend per share (¥) | 55.00 | 55.00 | unchanged |
JapanStockPulse provides informational content only and does not constitute investment advice. Figures are taken from the company's published earnings short report and may be subject to subsequent revision.