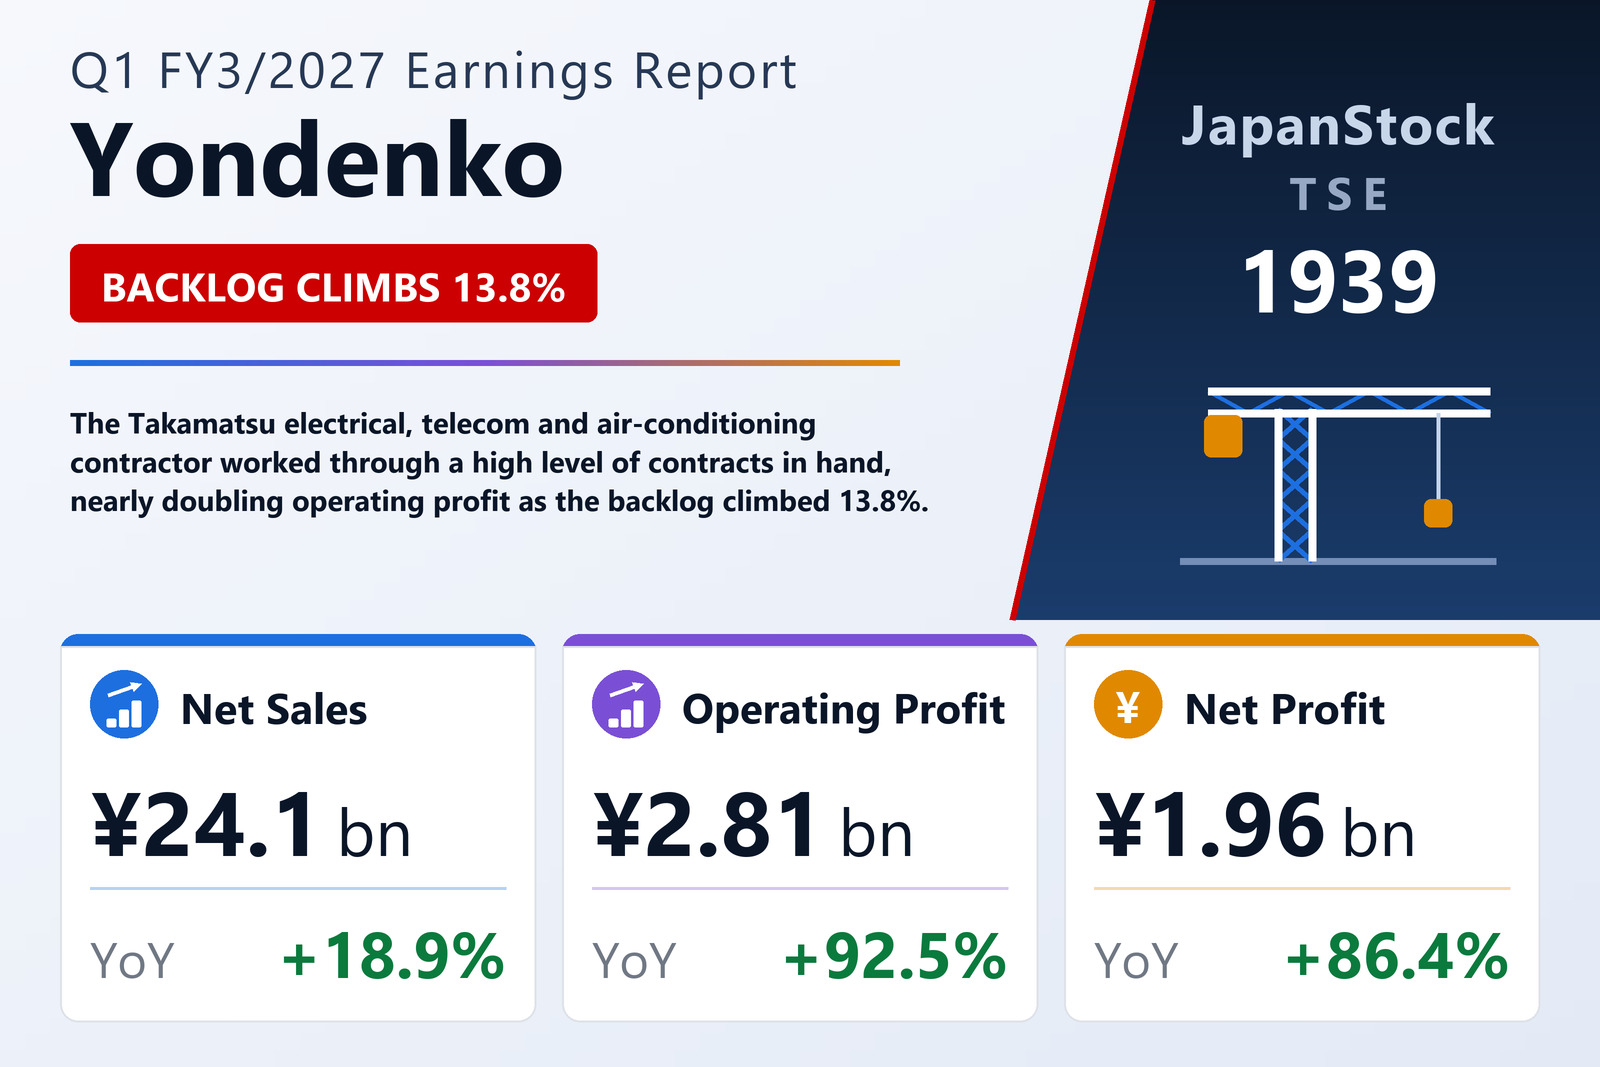
Yondenko Corporation (TSE: 1939), the Takamatsu-based contractor for electrical, power-distribution, telecommunications and air-conditioning and plumbing work, reported consolidated results for the first quarter of the fiscal year ending March 2027 — the three months from April 1 to June 30, 2026 — under Japanese GAAP. Net sales rose 18.9% to ¥24,089 million from ¥20,264 million, operating profit rose 92.5% to ¥2,815 million from ¥1,462 million, ordinary profit rose 90.3% to ¥2,928 million from ¥1,539 million and profit attributable to owners of the parent rose 86.4% to ¥1,959 million from ¥1,051 million. Basic earnings per share were ¥41.40 against ¥22.24; no diluted figure is presented. The comparative quarter had itself been a weak one, with sales down 13.0% and operating profit down 18.3%. Management attributed the recovery to steady progress on a high level of contracts in hand together with tighter schedule and cost control, and left the full-year guidance it issued on April 30 untouched.
Gross margin widened as construction costs lagged revenue
The profit leverage came from the completed-construction line. Completed construction sales rose 20.1% to ¥22,786 million while completed construction costs rose only 14.4% to ¥17,801 million, so completed-construction gross profit jumped 46.2% to ¥4,985 million and that margin widened to 21.9% from 18.0%. Other business sales were near-flat at ¥1,302 million against ¥1,287 million and contributed ¥393 million of gross profit against ¥432 million. Total gross profit therefore rose 40.0% to ¥5,379 million and the consolidated gross margin reached 22.3% against 19.0%. Selling, general and administrative expenses rose a much slower 7.8% to ¥2,564 million, lifting the operating margin to 11.7% from 7.2%. Below the operating line, non-operating income of ¥131 million against ¥86 million — interest, dividends received and property rental — exceeded non-operating expenses of ¥18 million, and after income taxes of ¥959 million against ¥477 million, quarterly profit of ¥1,967 million left ¥1,959 million attributable to owners of the parent once ¥7 million of non-controlling interests was deducted. Tax for the quarter was computed using an estimated annual effective rate, a quarterly-specific accounting treatment the company applies.
Order intake rose 10.6% and the backlog reached ¥66.0 billion
For a construction contractor the order book matters more than any single quarter's revenue, and both measures improved. Consolidated order intake rose 10.6% to ¥33,673 million from ¥30,442 million, an increase of ¥3,231 million. On a parent-only basis, contracts carried forward at June 30, 2026 stood at ¥66,043 million against ¥58,022 million a year earlier — up 13.8%, or ¥8,021 million. Electrical and instrumentation work is by far the largest slice of that backlog at ¥37,615 million, or 57.0%, up 12.5%; air-conditioning and plumbing accounts for ¥11,074 million (16.8%), up 2.4%; power distribution ¥7,459 million (11.3%), up 21.9%; power transmission and civil engineering ¥6,224 million (9.4%), up 37.0%; and information and telecommunications ¥3,668 million (5.5%), up 18.1%. Management described the order environment in the construction industry as favourable, particularly in urban areas, while flagging rising materials and equipment prices and labour shortages as continuing supply constraints, alongside resource-supply and price risks from prolonged instability in the Middle East.
Air-conditioning and plumbing work more than doubled at the parent
The tanshin's work-type detail is disclosed on a parent-only basis, where net sales rose 22.8% to ¥20,054 million, operating profit 94.4% to ¥1,529 million, ordinary profit 70.3% to ¥1,808 million and net profit 66.1% to ¥1,243 million, for parent earnings per share of ¥26.27 against ¥15.83. By work type, power distribution remained the single largest category at ¥9,394 million, or 46.8% of parent sales, up 6.4%. The sharpest move came from air-conditioning and plumbing, which rose 130.3% to ¥3,275 million from ¥1,422 million and took 16.3% of sales against 8.7%. Electrical and instrumentation work rose 29.0% to ¥5,206 million (26.0%), power transmission and civil engineering rose 20.9% to ¥1,175 million (5.9%), information and telecommunications fell 13.5% to ¥669 million (3.3%), and ancillary businesses contributed ¥332 million (1.7%). Parent order intake rose 9.2% to ¥29,105 million, led by power transmission and civil engineering at ¥3,131 million (up 78.4%) and information and telecommunications at ¥1,452 million (up 62.2%), while electrical and instrumentation orders slipped 7.7% to ¥9,324 million.
The Shikoku Electric group took half of new orders
Yondenko's customer mix remains anchored by the Shikoku Electric Power group — Shikoku Electric Power, Shikoku Electric Power Transmission & Distribution and Yonden T&D Service. That group placed ¥14,391 million of orders, 49.5% of the parent total, up 22.5% from ¥11,745 million and up from a 44.1% share. General private-sector customers accounted for ¥12,265 million (42.1%), up 7.1%, while public-sector orders fell 29.1% to ¥2,448 million and their share dropped to 8.4% from 12.9%. On the sales side the group supplied ¥10,608 million (52.9%), up 7.2%, but the fastest growth came from general private customers at ¥8,209 million, up 47.5%, and the public sector at ¥1,236 million, up 41.8%. The same pattern shows in the backlog: Shikoku Electric group work in hand rose 29.4% to ¥13,997 million and general private work rose 17.0% to ¥42,533 million — 64.4% of the total — while public-sector work in hand fell 12.2% to ¥9,512 million.
Facilities construction supplied the entire profit increase
Yondenko reports three segments plus an "other" bucket. Facilities construction generated external sales of ¥22,786 million against ¥18,976 million and segment profit of ¥2,641 million against ¥1,133 million — a 133.1% increase that more than accounts for the ¥1,353 million rise in consolidated operating profit. Leasing produced external sales of ¥458 million against ¥447 million and segment profit of ¥66 million, unchanged. Solar power generation was the one segment to go backwards, with external sales of ¥526 million against ¥555 million and segment profit down 19.7% to ¥179 million from ¥223 million. The "other" category — CAD software sales and designated-manager operations — contributed external sales of ¥317 million and profit of ¥30 million against ¥39 million. Inter-segment eliminations and adjustments deducted ¥102 million, against just ¥1 million a year earlier, bringing the total to the reported ¥2,815 million of operating profit.
Total assets fell 6.6% while the equity ratio rose to 72.7%
The balance sheet contracted sharply over the three months. Total assets fell ¥6,831 million to ¥97,039 million from ¥103,871 million at the March year-end. Cash and deposits rose to ¥16,916 million from ¥13,266 million and electronically recorded receivables to ¥3,275 million from ¥1,537 million, but notes and accounts receivable from completed construction fell to ¥20,139 million from ¥27,458 million and deposits with affiliated companies fell to nil from ¥5,000 million. Liabilities fell ¥6,335 million to ¥26,337 million, driven by trade payables for construction down to ¥7,766 million from ¥12,313 million and income taxes payable down to ¥1,074 million from ¥2,514 million. Net assets edged down ¥496 million to ¥70,702 million: retained earnings slipped to ¥58,380 million from ¥58,550 million because the ¥45.00-per-share year-end dividend for the year to March 2026 more than absorbed the quarter's profit, and unrealised gains on available-for-sale securities fell to ¥3,403 million from ¥3,615 million. Because assets shrank faster than equity, the equity ratio rose to 72.7% from 68.4% even though shareholders' equity itself dipped to ¥70,594 million from ¥71,092 million.
Comprehensive income undershot net profit on negative valuation moves
One line runs the other way. Comprehensive income of ¥1,639 million — up 45.9% from ¥1,124 million — came in below the ¥1,967 million of quarterly profit, because other comprehensive income was a negative ¥327 million: a ¥212 million reduction in unrealised gains on available-for-sale securities and a ¥115 million negative retirement-benefit adjustment. A year earlier other comprehensive income had been a positive ¥64 million, which is why comprehensive income grew far more slowly than net profit. Of the total, ¥1,631 million was attributable to owners of the parent and ¥7 million to non-controlling interests. No consolidated cash flow statement is prepared for the first quarter; depreciation was ¥476 million against ¥480 million and goodwill amortisation ¥23 million in both periods. There was no material change to the scope of consolidation, no change in accounting policies or estimates, and the quarterly financial statements were not subject to audit or review by a certified public accountant.
Guidance unchanged — but April–June is the seasonal trough
Yondenko reaffirmed the full-year plan it published on April 30: net sales of ¥108,000 million, up 8.6%, operating profit of ¥9,400 million, up 6.5%, ordinary profit of ¥9,900 million, up 6.1%, and profit attributable to owners of the parent of ¥6,600 million, down 12.0%, for earnings per share of ¥139.43. Readers should not annualise the first-quarter growth rates. For a Japanese construction contractor the April–June quarter is the seasonal trough, because completions — and therefore revenue recognition — concentrate in the January–March fourth quarter: this quarter delivered only 22.3% of the full-year sales plan, alongside 29.9% of the operating-profit plan, 29.6% of the ordinary-profit plan and 29.7% of the net-profit plan. The company's own guidance still calls for full-year net profit to fall 12.0% despite the 86.4% first-quarter increase. On dividends, Yondenko paid ¥32.00 at the interim and ¥45.00 at the year-end for a ¥77.00 total in the year to March 2026, and forecasts ¥42.00 and ¥42.00 for an ¥84.00 total in the year to March 2027 — unchanged from its previous announcement. Shares issued including treasury stock were unchanged at 48,766,410, treasury shares stood at 1,431,799 against 1,431,731, and the weighted-average count used for earnings per share was 47,334,630 against 47,278,527 a year earlier.
| Metric | Q1 FY3/2027 | Q1 FY3/2026 | YoY |
|---|---|---|---|
| Net sales (¥ million) | 24,089 | 20,264 | +18.9% |
| Completed construction sales (¥ million) | 22,786 | 18,976 | +20.1% |
| Gross profit (¥ million) | 5,379 | 3,841 | +40.0% |
| Gross margin (%) | 22.3 | 19.0 | +3.4 pt |
| SG&A expenses (¥ million) | 2,564 | 2,379 | +7.8% |
| Operating profit (¥ million) | 2,815 | 1,462 | +92.5% |
| Operating margin (%) | 11.7 | 7.2 | +4.5 pt |
| Ordinary profit (¥ million) | 2,928 | 1,539 | +90.3% |
| Profit attributable to owners of parent (¥ million) | 1,959 | 1,051 | +86.4% |
| Comprehensive income (¥ million) | 1,639 | 1,124 | +45.9% |
| Basic EPS (¥) | 41.40 | 22.24 | +86.2% |
| Consolidated order intake (¥ million) | 33,673 | 30,442 | +10.6% |
| Facilities construction segment profit (¥ million) | 2,641 | 1,133 | +133.1% |
| Leasing segment profit (¥ million) | 66 | 66 | ±0.0% |
| Solar power segment profit (¥ million) | 179 | 223 | −19.7% |
| Parent-only backlog (¥ million, at Jun 30) | 66,043 | 58,022 | +13.8% |
| Total assets (¥ million, vs FY3/26 year-end) | 97,039 | 103,871 | −6.6% |
| Net assets (¥ million, vs FY3/26 year-end) | 70,702 | 71,199 | −0.7% |
| Equity ratio (%, vs FY3/26 year-end) | 72.7 | 68.4 | +4.3 pt |
| FY3/27 net sales plan (¥ million, vs Q1 actual) | 108,000 | 24,089 | 22.3% of plan |
| FY3/27 operating profit plan (¥ million, vs Q1 actual) | 9,400 | 2,815 | 29.9% of plan |
| FY3/27 profit attributable to owners plan (¥ million, vs Q1 actual) | 6,600 | 1,959 | 29.7% of plan |
| Annual dividend (¥, FY3/27 forecast vs FY3/26 actual) | 84.00 | 77.00 | +¥7.00 |
JapanStockPulse provides informational content only and does not constitute investment advice. Figures are taken from the company's published earnings short report and may be subject to subsequent revision.