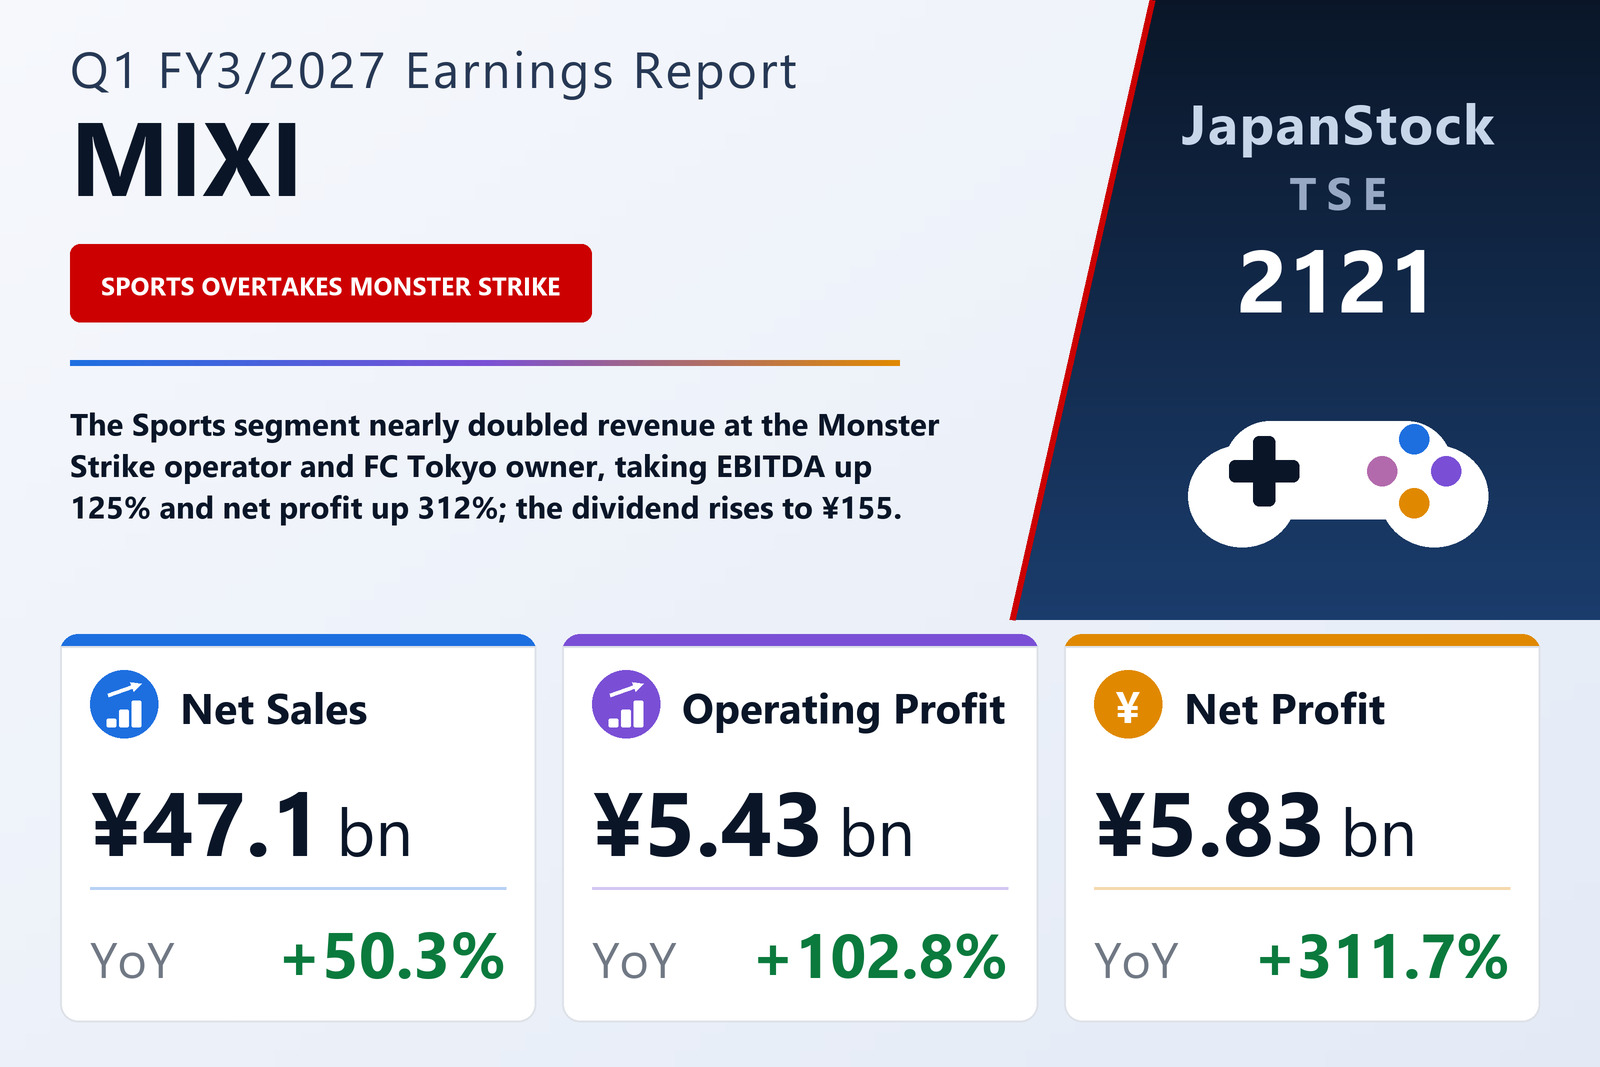
MIXI, Inc. (TSE: 2121), the Tokyo-based operator of the smartphone game Monster Strike and owner of sports properties including football club FC Tokyo and basketball's Chiba Jets, reported consolidated results for the first quarter of the fiscal year ending March 2027 — the three months from April 1 to June 30, 2026 — under Japanese GAAP. Net sales rose 50.3% to ¥47,073 million from ¥31,323 million, EBITDA 125.0% to ¥8,637 million from ¥3,839 million, operating profit 102.8% to ¥5,428 million from ¥2,677 million, ordinary profit 179.3% to ¥5,652 million from ¥2,023 million and profit attributable to owners of the parent 311.7% to ¥5,825 million from ¥1,414 million. Basic earnings per share were ¥89.47 against ¥20.92, with a diluted figure of ¥88.59 against ¥20.67, and comprehensive income reached ¥6,143 million, up 144.6%. The company revised both its full-year plan and its dividend forecast on the same day.
What MIXI's headline EBITDA line actually measures
MIXI is unusual among Japanese issuers in printing EBITDA on the front page of its earnings report, between revenue and operating profit, and in using it as the profit measure for each reporting segment. The company defines it narrowly: operating profit before depreciation and goodwill amortisation. The arithmetic for the quarter is ¥5,428 million of operating profit plus ¥2,496 million of depreciation and ¥712 million of goodwill amortisation, giving ¥8,637 million. A year earlier the same build was ¥2,677 million plus ¥845 million and ¥316 million, or ¥3,839 million. The two add-backs therefore grew far faster than the business itself — depreciation rose 195.4% and goodwill amortisation 125.3%, largely a consequence of consolidating the Australian betting operator PointsBet — which is why EBITDA growth of 125.0% runs well ahead of the 102.8% recorded at the operating line. Investors reading the headline number should note that the gap between the two is a real, cash-relevant acquisition cost being amortised, not an artefact.
Sports nearly doubled revenue and overtook Monster Strike
For the first time, Sports was MIXI's largest segment by revenue. Sales rose 94.5% to ¥21,673 million from ¥11,143 million and segment profit 108.0% to ¥1,258 million from ¥604 million, putting the division ahead of Digital Entertainment's ¥19,532 million and accounting for 46.0% of group revenue. The segment contributed ¥10,530 million of the ¥15,750 million increase in group sales — roughly two-thirds of the total. In betting, the consolidation of PointsBet Holdings Limited in September of the previous fiscal year lifted revenue, while Chari-Loto Co., Ltd. performed strongly in its comprehensive outsourced operation of keirin velodromes and Net Dreamers Co., Ltd. grew bicycle-race ticket sales. In the spectator business, ticket sales at FC Tokyo and the Chiba Jets were strong; FC Tokyo changed its fiscal year-end, so five months of its results, from February to June 2026, are consolidated into this single quarter. Profitability remains thin by group standards: the segment margin was 5.8%, against 5.4% a year earlier.
Digital Entertainment grew on spending per user, not on user numbers
Digital Entertainment, which earns most of its money from Monster Strike, lifted sales 21.5% to ¥19,532 million and segment profit 39.5% to ¥10,881 million. Management was explicit about the mix: monthly active users declined, but average revenue per user increased, and that was enough to produce higher revenue. Cost efficiencies then amplified the effect at the profit line, taking the segment margin to 55.7% from 48.5%. Despite Sports overtaking it on revenue, gaming still supplies the overwhelming majority of the group's earnings — ¥10,881 million of the ¥13,261 million of combined segment profit, or 82.1%.
Lifestyle and Investment both swung from loss to profit
The two smaller segments each turned positive. Lifestyle — home to the family photo and video sharing app Mitene, the salon-booking app minimo and the mixi and mixi2 social networks — raised sales 24.5% to ¥4,363 million and posted segment profit of ¥261 million against a ¥69 million loss, on growth in Mitene's focus areas (Mitene Premium, photo printing, the Mitene Mimamori GPS tracker and advertising) and at minimo. Investment, which takes stakes in startups and venture capital funds, lifted revenue 158.1% to ¥1,502 million and swung to ¥860 million of segment profit from a ¥39 million loss, on sales of holdings and the pick-up of gains at funds the group invests in. The four segments together produced ¥13,261 million of profit; adjustments of −¥7,832 million — comprising ¥2,324 million of segment depreciation, ¥712 million of goodwill amortisation and ¥4,796 million of unallocated corporate costs — bridge that to the ¥5,428 million reported operating profit.
Why net profit finished above ordinary profit
The step-up in growth rates down the income statement — revenue up 50.3%, operating profit 102.8%, ordinary profit 179.3%, net profit 311.7% — ends with net profit ¥173 million above ordinary profit, which is unusual and has two specific causes below the ordinary line. Non-operating items first widened the gap at the ordinary level: non-operating income of ¥578 million, including ¥400 million of foreign exchange gains where there were none a year earlier, exceeded non-operating expenses of ¥353 million, against income of ¥96 million and expenses of ¥750 million in the prior-year quarter, when a ¥584 million equity-method investment loss weighed on the result. Extraordinary items were negligible — ¥2 million of income against ¥7 million of losses — leaving pre-tax quarterly profit of ¥5,647 million, up 148.3%.
From there, tax did most of the work. Current income taxes of ¥1,895 million were offset by a deferred tax credit of ¥1,555 million, leaving a total tax charge of just ¥339 million — an effective rate of 6.0%, against 35.3% in the same quarter last year, when the charge was ¥802 million. Quarterly profit was therefore ¥5,308 million. The final step is minority interests: ¥516 million of losses attributable to non-controlling interests were added back, because outside shareholders in partly owned subsidiaries absorbed that share of the losses those units made. A year earlier both effects ran the other way — a full tax charge and ¥57 million of profit attributable to non-controlling interests — so profit attributable to owners of the parent came to ¥1,414 million. This quarter the same mechanics produced ¥5,825 million, above the ¥5,652 million ordinary profit line.
Cash fell as MIXI cancelled 2.8 million treasury shares and paid dividends
Total assets closed at ¥282,828 million against ¥280,405 million at the March year-end. Current assets rose ¥1,680 million to ¥178,020 million as an increase in operating investment securities outweighed a decline in cash and deposits, and non-current assets rose ¥743 million to ¥104,808 million on higher investment securities. Current liabilities fell ¥2,450 million to ¥37,572 million on lower income taxes payable and accounts payable, and non-current liabilities fell ¥1,035 million to ¥49,881 million on repayment of long-term borrowings. Net assets rose ¥5,908 million to ¥195,375 million, shareholders' equity to ¥187,798 million from ¥181,492 million, and the equity ratio improved to 66.4% from 64.7%. Cash and cash equivalents ended at ¥109,212 million, down ¥1,978 million: operating activities generated ¥3,326 million — a swing from ¥13,892 million used a year earlier — as the ¥5,647 million pre-tax profit outweighed ¥3,808 million of tax payments; investing used ¥1,249 million, with ¥2,642 million of capital expenditure and ¥981 million of investment-securities purchases against a ¥3,000 million time-deposit withdrawal; and financing used ¥4,349 million, almost entirely the ¥3,443 million of dividends paid.
Following a board resolution of May 15, 2026, MIXI cancelled 2,800,000 treasury shares on May 29, reducing both retained earnings and treasury stock by ¥8,574 million. Shares issued including treasury stock fell to 68,530,850 from 71,330,850, treasury shares to 3,424,404 from 6,224,404, and the weighted average count used for earnings per share to 65,106,446 from 67,621,650. Separately, MIXI adopted the revised Practical Guidelines on Accounting for Financial Instruments from the start of the quarter, measuring qualifying partnership investments on the basis of the fair value of their unlisted constituent shares; at the opening balance sheet this increased operating investment securities by ¥5,174 million, deferred tax liabilities by ¥1,610 million and the valuation difference on available-for-sale securities by ¥3,563 million. There was no material change to the scope of consolidation, and the quarterly consolidated financial statements were not subject to audit or review by a certified public accountant or audit firm.
Guidance cut at the operating line, raised at the bottom line by a ¥12.2 billion bitbank gain
MIXI revised the full-year plan it published on May 15, 2026. For the year to March 2027 it now guides net sales of ¥185,000 million, up 8.0%, EBITDA of ¥31,500 million, up 1.0%, operating profit of ¥19,500 million, down 12.4%, ordinary profit of ¥20,000 million, down 19.0%, and profit attributable to owners of the parent of ¥25,000 million, up 44.8%, for earnings per share of ¥383.99. The divergence — falling operating and ordinary profit but a sharply higher bottom line — is explained by a transaction disclosed in the notes. On June 25, 2026 the board resolved to enter a basic agreement to sell its entire stake in equity-method affiliate bitbank, Inc. to SBICAH G.K., a wholly owned subsidiary of SBI Holdings, Inc., through SBICAH's acquisition of bitbank shares, a third-party allotment to SBICAH and a share buyback by bitbank itself. If completed — the transaction is scheduled for October 2026 — bitbank will cease to be an equity-method affiliate and MIXI expects to book a gain on sale of affiliate shares of ¥12,231 million as extraordinary income in the third quarter. The company cautions that the amount may change with the final transfer price, transaction costs, tax and accounting treatment and the timing of completion. Against the revised plan, the first quarter delivered 25.4% of guided sales, 27.4% of guided EBITDA, 27.8% of guided operating profit and 23.3% of guided net profit.
Dividend forecast lifted to ¥155.00, entirely at the year-end
MIXI paid ¥60.00 at the interim and ¥60.00 at the year-end for the fiscal year ended March 2026, a total of ¥120.00. For the year ending March 2027 it now forecasts an unchanged ¥60.00 interim payment and a year-end payment of ¥95.00, for an annual total of ¥155.00 — a rise of 29.2% delivered entirely through the final dividend. The earnings report explicitly flags this as a revision to the previously announced dividend forecast, disclosed the same day as the revision to the full-year plan. No dividends are scheduled at the first- or third-quarter ends. Set against guided earnings per share of ¥383.99, the ¥155.00 annual payout implies a payout ratio of 40.4%.
| Metric | Q1 FY3/2027 | Q1 FY3/2026 | YoY |
|---|---|---|---|
| Net sales (¥ million) | 47,073 | 31,323 | +50.3% |
| EBITDA (¥ million) | 8,637 | 3,839 | +125.0% |
| Operating profit (¥ million) | 5,428 | 2,677 | +102.8% |
| Ordinary profit (¥ million) | 5,652 | 2,023 | +179.3% |
| Pre-tax quarterly profit (¥ million) | 5,647 | 2,274 | +148.3% |
| Income taxes (¥ million) | 339 | 802 | −57.7% |
| Effective tax rate (%) | 6.0 | 35.3 | −29.3 pt |
| Profit attributable to owners of parent (¥ million) | 5,825 | 1,414 | +311.7% |
| Comprehensive income (¥ million) | 6,143 | 2,511 | +144.6% |
| Basic EPS (¥) | 89.47 | 20.92 | +327.7% |
| Diluted EPS (¥) | 88.59 | 20.67 | +328.6% |
| Digital Entertainment revenue (¥ million) | 19,532 | 16,076 | +21.5% |
| Digital Entertainment segment profit (¥ million) | 10,881 | 7,801 | +39.5% |
| Sports revenue (¥ million) | 21,673 | 11,143 | +94.5% |
| Sports segment profit (¥ million) | 1,258 | 604 | +108.0% |
| Lifestyle revenue (¥ million) | 4,363 | 3,505 | +24.5% |
| Lifestyle segment profit / (loss) (¥ million) | 261 | −69 | To profit |
| Investment revenue (¥ million) | 1,502 | 582 | +158.1% |
| Investment segment profit / (loss) (¥ million) | 860 | −39 | To profit |
| Depreciation (¥ million) | 2,496 | 845 | +195.4% |
| Goodwill amortisation (¥ million) | 712 | 316 | +125.3% |
| Operating cash flow (¥ million) | 3,326 | −13,892 | To inflow |
| Cash and equivalents (¥ million, vs FY3/26 year-end) | 109,212 | 111,190 | −1.8% |
| Total assets (¥ million, vs FY3/26 year-end) | 282,828 | 280,405 | +0.9% |
| Net assets (¥ million, vs FY3/26 year-end) | 195,375 | 189,466 | +3.1% |
| Shareholders' equity (¥ million, vs FY3/26 year-end) | 187,798 | 181,492 | +3.5% |
| Equity ratio (%, vs FY3/26 year-end) | 66.4 | 64.7 | +1.7 pt |
| FY3/27 net sales guidance (¥ million) | 185,000 | — | +8.0% |
| FY3/27 EBITDA guidance (¥ million) | 31,500 | — | +1.0% |
| FY3/27 operating profit guidance (¥ million) | 19,500 | — | −12.4% |
| FY3/27 ordinary profit guidance (¥ million) | 20,000 | — | −19.0% |
| FY3/27 net profit guidance (¥ million) | 25,000 | — | +44.8% |
| FY3/27 EPS guidance (¥) | 383.99 | — | — |
| Annual dividend (¥, FY3/27 forecast vs FY3/26 actual) | 155.00 | 120.00 | +29.2% |
JapanStockPulse provides informational content only and does not constitute investment advice. Figures are taken from the company's published earnings short report and may be subject to subsequent revision.