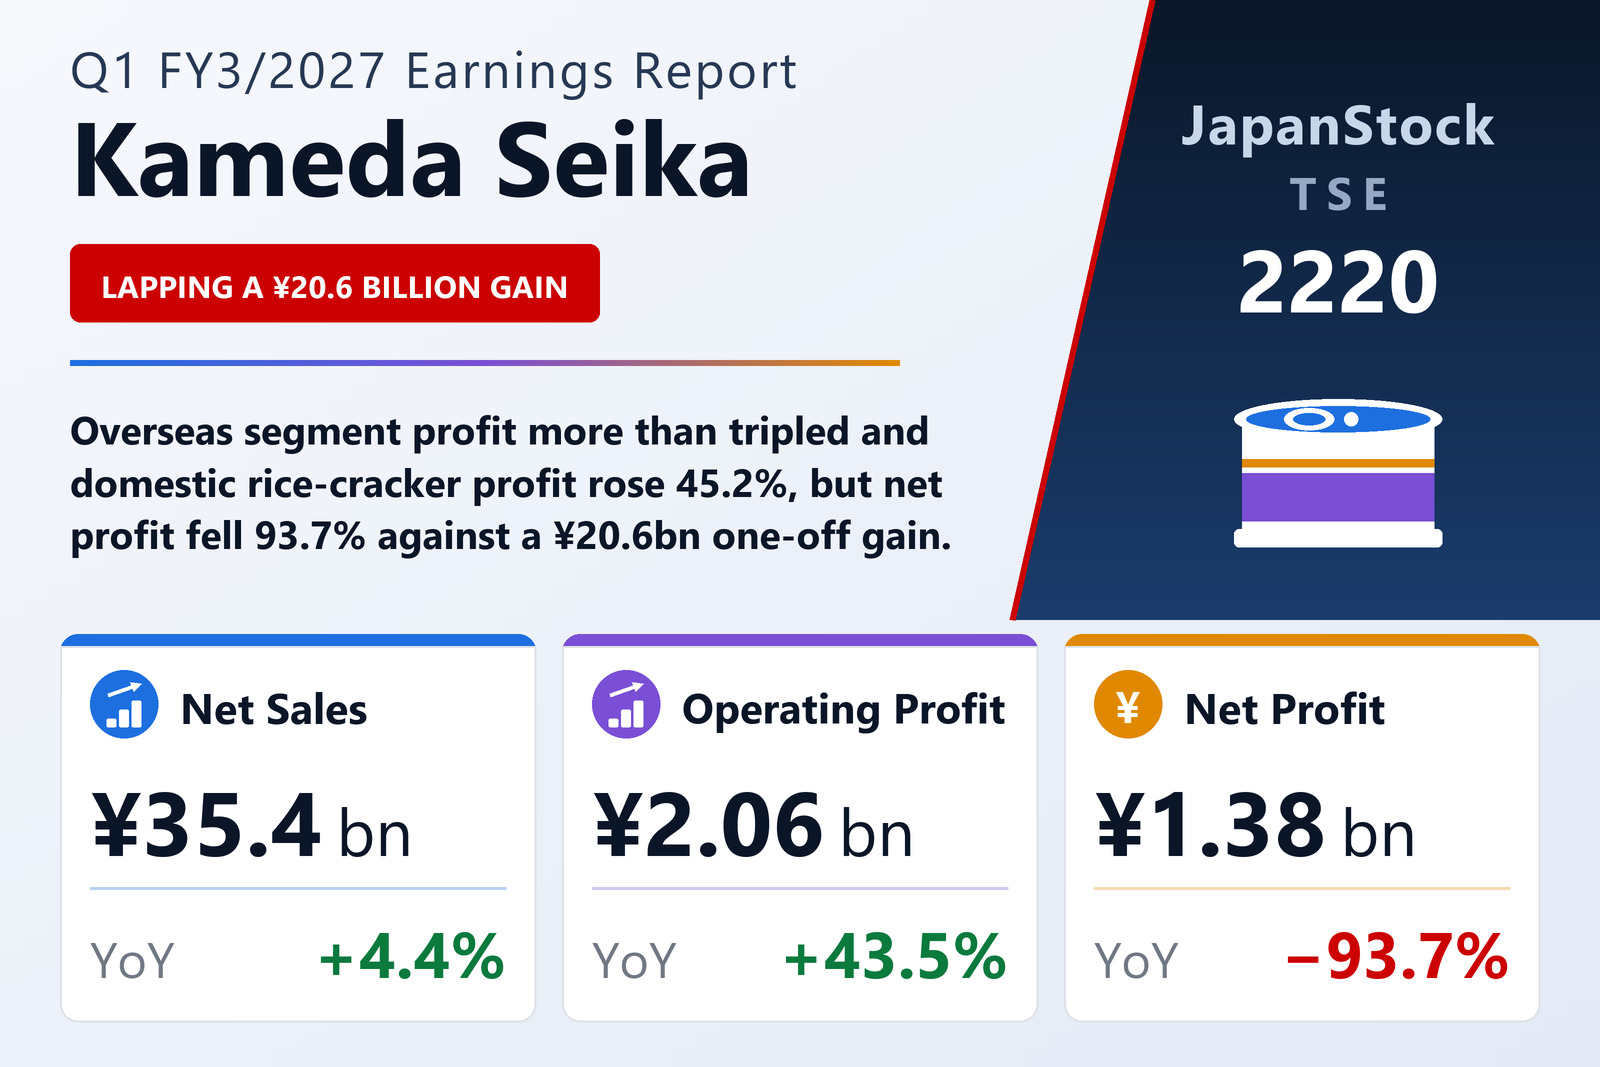
Kameda Seika Co., Ltd. (TSE: 2220), the Niigata-based maker of rice crackers and snack foods behind Kameda no Kakinotane and Happy Turn, reported consolidated results for the first quarter of the fiscal year ending March 2027 — the three months from April 1 to June 30, 2026 — under Japanese GAAP. Net sales rose 4.4% to ¥35,370 million, operating profit 43.5% to ¥2,061 million and ordinary profit 58.4% to ¥2,108 million. Profit attributable to owners of the parent fell 93.7% to ¥1,375 million, but that decline is a base effect rather than a deterioration: the year-earlier quarter contained ¥21,002 million of extraordinary income, of which ¥20,598 million was a gain on step acquisition recognised when TH FOODS, INC. became a consolidated subsidiary. Basic earnings per share were ¥21.75 against ¥346.91, with no diluted figure reported. The company left both its first-half and full-year forecasts unchanged.
The 93.7% profit drop is entirely a one-off base effect
The distortion is easy to isolate because it sat below the ordinary-profit line. Extraordinary income in the year-earlier quarter totalled ¥21,002 million: ¥20,598 million of gain on step acquisition, booked when Kameda Seika acquired additional shares in TH FOODS, INC. and brought the US company into consolidation with a deemed acquisition date of April 1, 2025, plus ¥403 million of gain on sale of affiliate shares from the disposal of its entire holding in Mary's Gone Crackers, Inc. Set against extraordinary losses of only ¥19 million, that lifted pre-tax profit to ¥22,313 million on ordinary profit of just ¥1,330 million — roughly sixteen times the underlying figure. The quarter just reported carried no extraordinary income at all and ¥17 million of loss on disposal of fixed assets, leaving pre-tax profit of ¥2,091 million. Ordinary profit, the last line untouched by the gain, is the meaningful comparison, and it improved 58.4%. Comprehensive income of ¥2,606 million was 85.3% lower for exactly the same reason.
Domestic rice crackers lifted profit 45% on price revisions and product mix
The domestic rice-cracker business, the group's largest segment, grew external sales 3.3% to ¥18,235 million and segment profit 45.2% to ¥1,447 million. Management credited the carry-over effect of price revisions implemented in the previous year, an improved product mix from concentrating on six priority brands, more efficient sales-promotion spending and higher production efficiency. Within those six brands, Happy Turn, Kameda no Tsumamidane and Waza no Kodawari grew year on year while Kameda no Kakinotane, the Mugen series and Kotsubukko declined. Kameda no Kakinotane marks its 60th anniversary this year and Happy Turn its 50th, and the company is running anniversary campaigns that began with an April collaboration product between the two brands, followed by television advertising, a specialty shop at Tokyo Station and pop-up events. It also launched a new product built around the concept of a snack that delivers near-meal satisfaction, aimed at the meal-replacement market. Group companies making department-store and souvenir products worked on capturing inbound demand and opening new growth channels.
Overseas profit more than tripled on TH FOODS in North America
Overseas sales rose 9.3% to ¥13,284 million and segment profit 211.4% to ¥556 million — the single largest contributor to the group's ¥625 million gain in operating profit. In North America, TH FOODS saw its B2B (bulk) business lose volume temporarily following price revisions, but a strong B2C business more than offset that and profitability improved sharply. In Asia, the OEM business in Thailand and Cambodia grew, while the own-brand business in Vietnam and China contracted as the Chinese subsidiary's domestic sales fell short of plan; the Thai company gained from higher exports to the United States and a weaker baht, but the Chinese unit's revenue decline pulled regional profit down overall. The segment carries the goodwill created by the TH FOODS transaction, ¥13,827 million as revised in the finalised purchase-price allocation. Group-wide goodwill amortisation was ¥234 million against ¥217 million a year earlier.
Food segment slipped as emergency-ration demand normalised
The food segment — long-life emergency rations, plant-based lactic acid bacteria, rice-flour bread and plant-based foods — saw sales fall 7.3% to ¥2,026 million and segment profit 31.4% to ¥96 million, with the profit decline driven mainly by lower revenue at Onishi Foods. Long-life food ran into the reaction against an unusually high level of consumer demand a year earlier, although government and corporate stockpiling demand held firm. The company is expanding distribution of its Okome Shokupan rice-flour bread, pushing plant-based lactic acid bacteria into European, US and Asian markets on functional claims, and working to raise recognition of plant-based food as a protein ingredient. The remaining "Other" segment, mainly freight transport, saw sales slip 3.3% to ¥1,825 million and swung to a ¥39 million segment loss from ¥119 million of profit. Group-wide, the operating margin improved to 5.8% from 4.2%.
Balance sheet strengthened, equity ratio at 55.2%
Total assets ended the quarter at ¥189,058 million, ¥834 million above the March year-end. Current assets fell ¥1,097 million to ¥55,709 million as cash and deposits declined ¥444 million and notes, accounts receivable and contract assets ¥1,368 million, partly offset by ¥313 million more merchandise and finished goods and a ¥411 million rise in other current assets. Fixed assets rose ¥1,932 million to ¥133,349 million, with other property, plant and equipment up ¥2,633 million and customer-relationship assets up ¥128 million against declines of ¥270 million in buildings and structures and ¥895 million in machinery and vehicles. Total liabilities fell ¥348 million to ¥81,408 million: short-term borrowings were cut ¥2,148 million and long-term borrowings ¥1,330 million, against a ¥858 million increase in the bonus provision, ¥511 million more electronically recorded obligations and ¥1,838 million more other non-current liabilities. Net assets rose ¥1,183 million to ¥107,649 million, as retained earnings gained ¥300 million — the ¥1,375 million quarterly profit less ¥1,075 million of dividends — and the foreign currency translation adjustment added ¥1,176 million. The equity ratio improved to 55.2% from 54.7% and net assets per share to ¥1,649.43 from ¥1,627.34. No quarterly cash flow statement was prepared; depreciation for the period was ¥2,503 million against ¥2,385 million a year earlier.
Full-year guidance left untouched at ¥143.0 billion of sales
Kameda Seika left the forecasts it published on May 13, 2026 unchanged. For the first half it expects net sales of ¥69,000 million (+4.9%), operating profit of ¥3,000 million (+50.4%), ordinary profit of ¥2,700 million (+35.9%) and profit attributable to owners of ¥1,400 million (−93.7%), for earnings per share of ¥22.13. For the full year it guides net sales of ¥143,000 million (+3.6%), operating profit of ¥8,300 million (+10.3%), ordinary profit of ¥7,700 million (+2.6%) and profit attributable to owners of ¥4,300 million (−82.6%), for earnings per share of ¥67.99. The first quarter therefore delivered 24.8% of the full-year operating-profit plan and 68.7% of the first-half plan. The declines shown on the bottom line of both forecasts carry the same one-off base effect described above; on the operating line the company is guiding to double-digit growth.
Dividend forecast of ¥24.00 is stated on a post-split basis
The annual dividend forecast for the year to March 2027 is ¥24.00 — ¥5.00 at the half-year and ¥19.00 at the year-end — unchanged from the previous announcement. That figure is stated on a post-split basis; the company notes that without the three-for-one split it would be ¥72.00. The prior-year row is not restated: Kameda Seika actually paid ¥66.00 for the year to March 2026, made up of a ¥15.00 interim and a ¥51.00 year-end dividend, on the pre-split share count. The two totals are therefore comparable only once the ¥72.00 pre-split equivalent is used, which points to a ¥6.00 increase. No dividend was paid at the first quarter-end in either year, and no payment date is set for the current quarter.
A stock split and a finalised business combination reshape every comparison
Two adjustments underlie the figures above, and the company flags both explicitly. First, a three-for-one split of common stock took effect on April 1, 2026. Per-share figures — earnings per share, net assets per share and the share counts — are calculated as if the split had occurred at the start of the previous fiscal year, so the ¥21.75 against ¥346.91 comparison is like-for-like; the FY3/27 dividend forecast reflects the split, while the FY3/26 dividend actuals do not. Second, the provisional accounting for the TH FOODS business combination was finalised at the March 2026 year-end, and the year-earlier quarter has been restated to reflect it: cost of sales increased ¥246 million, selling, general and administrative expenses fell ¥79 million and deferred income taxes fell ¥122 million, reducing prior-year operating, ordinary and pre-tax profit by ¥167 million each and profit attributable to owners by ¥45 million. Every year-on-year percentage in the report, including the segment figures, is computed against that restated base. Shares issued including treasury stock stood at 66,955,950 at both dates, treasury shares at 3,706,800, and the weighted-average count used for earnings per share was 63,249,150 against 63,249,990. There was no material change to the scope of consolidation, no change in accounting policies or estimates, and the quarterly financial statements were not subject to review by a certified public accountant or auditing firm. Supplementary earnings materials are scheduled for publication on the company's website on August 7, 2026.
| Metric | Q1 FY3/2027 | Q1 FY3/2026 | YoY |
|---|---|---|---|
| Net sales (¥ million) | 35,370 | 33,873 | +4.4% |
| Domestic rice crackers — sales (¥ million) | 18,235 | 17,649 | +3.3% |
| Overseas — sales (¥ million) | 13,284 | 12,150 | +9.3% |
| Food — sales (¥ million) | 2,026 | 2,186 | −7.3% |
| Other (freight transport etc.) — sales (¥ million) | 1,825 | 1,887 | −3.3% |
| Operating profit (¥ million) | 2,061 | 1,436 | +43.5% |
| Operating margin (%) | 5.8 | 4.2 | +1.6 pt |
| Domestic rice crackers — segment profit (¥ million) | 1,447 | 996 | +45.2% |
| Overseas — segment profit (¥ million) | 556 | 178 | +211.4% |
| Food — segment profit (¥ million) | 96 | 141 | −31.4% |
| Other — segment profit (¥ million) | −39 | 119 | — |
| Ordinary profit (¥ million) | 2,108 | 1,330 | +58.4% |
| Extraordinary income (¥ million) | 0 | 21,002 | — |
| — of which gain on step acquisition (¥ million) | 0 | 20,598 | — |
| Profit before income taxes (¥ million) | 2,091 | 22,313 | −90.6% |
| Profit attributable to owners of parent (¥ million) | 1,375 | 21,942 | −93.7% |
| Basic EPS (¥, split-adjusted) | 21.75 | 346.91 | −93.7% |
| Comprehensive income (¥ million) | 2,606 | 17,724 | −85.3% |
| Depreciation (¥ million) | 2,503 | 2,385 | +4.9% |
| Goodwill amortisation (¥ million) | 234 | 217 | +7.8% |
| Total assets (¥ million, vs FY3/26 year-end) | 189,058 | 188,223 | +0.4% |
| Net assets (¥ million, vs FY3/26 year-end) | 107,649 | 106,466 | +1.1% |
| Equity ratio (%, vs FY3/26 year-end) | 55.2 | 54.7 | +0.5 pt |
| Net assets per share (¥, vs FY3/26 year-end) | 1,649.43 | 1,627.34 | +1.4% |
| FY3/27 net sales guidance (¥ million) | 143,000 | — | +3.6% |
| FY3/27 operating profit guidance (¥ million) | 8,300 | — | +10.3% |
| FY3/27 ordinary profit guidance (¥ million) | 7,700 | — | +2.6% |
| FY3/27 net profit guidance (¥ million) | 4,300 | — | −82.6% |
| FY3/27 EPS guidance (¥) | 67.99 | — | — |
| Annual dividend (¥, FY3/27 forecast post-split vs FY3/26 actual pre-split) | 24.00 | 66.00 | — |
JapanStockPulse provides informational content only and does not constitute investment advice. Figures are taken from the company's published earnings short report and may be subject to subsequent revision.