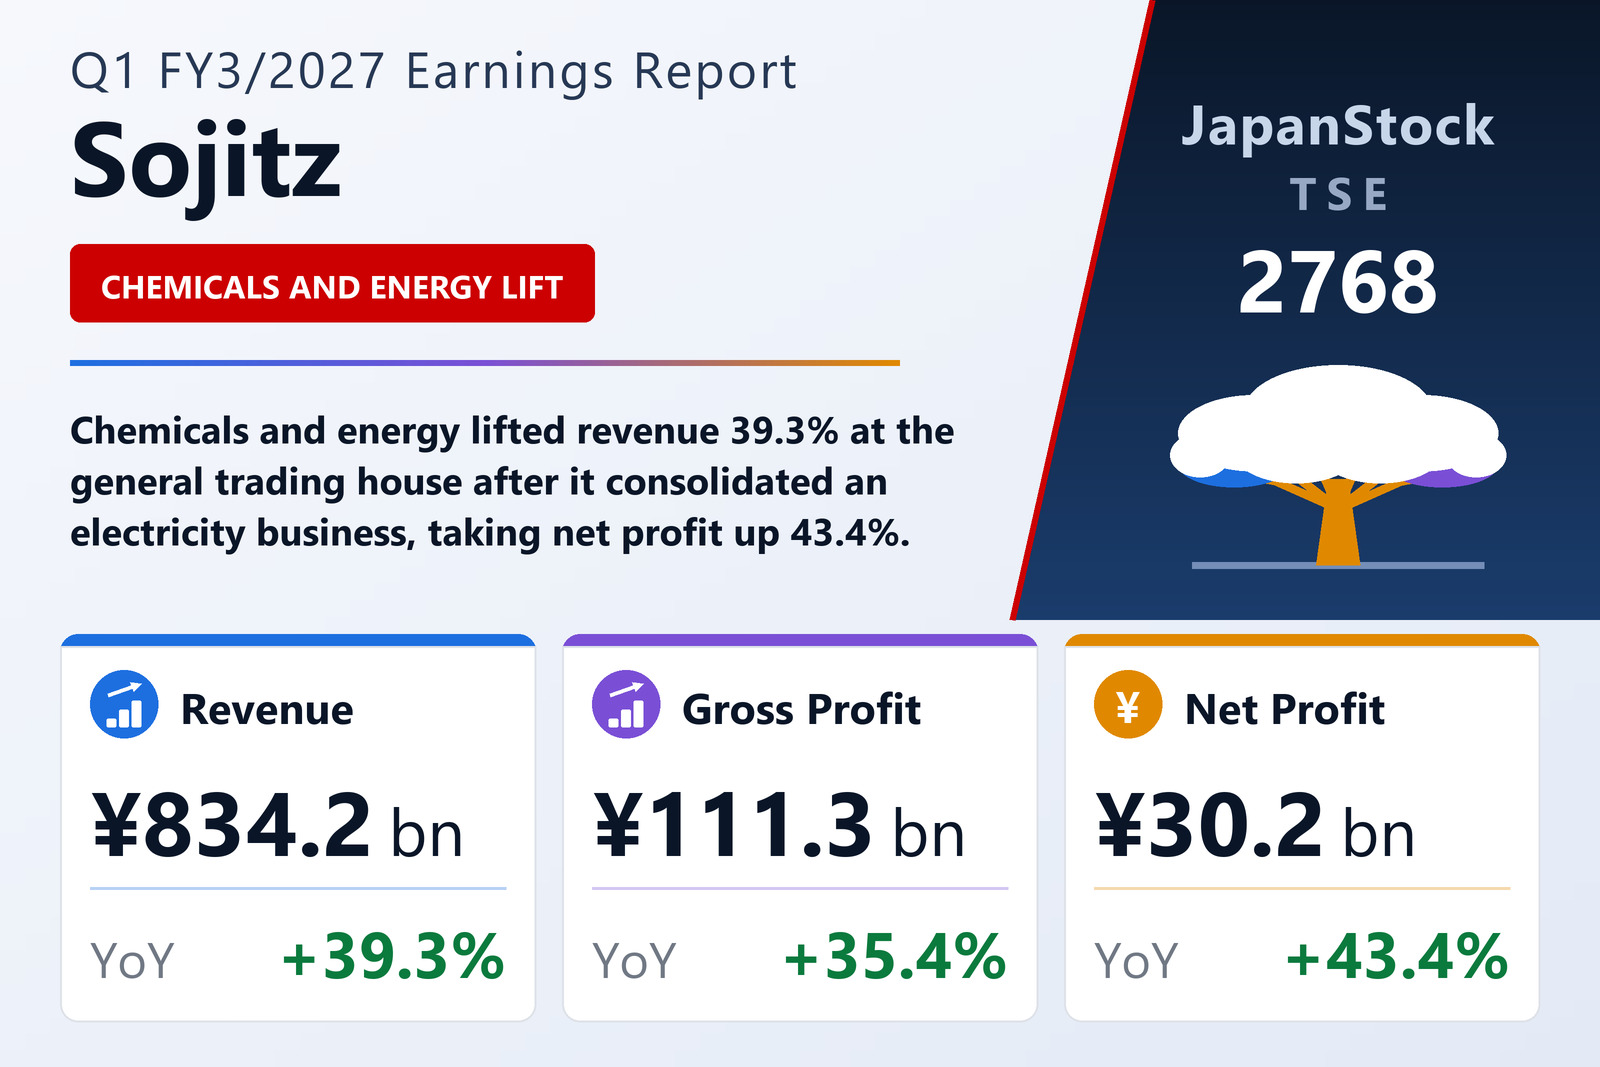
Sojitz Corporation (TSE: 2768), the Tokyo-based general trading house, reported consolidated results for the first quarter of the fiscal year ending March 2027 — the three months from April 1 to June 30, 2026 — under IFRS. Revenue rose 39.3% to ¥834,249 million from ¥598,901 million, gross profit 35.4% to ¥111,347 million, profit before tax 64.8% to ¥41,117 million, quarterly profit 47.4% to ¥32,357 million and profit attributable to owners of the parent 43.4% to ¥30,222 million. Basic and diluted earnings per share were both ¥144.72, against ¥100.30 a year earlier. Every one of those lines had gone backwards in the comparable quarter of the previous year — revenue by 4.0%, profit before tax by 21.6% and profit attributable to owners by 8.5% — so the three months represent a clean reversal rather than an extension of trend. The quarter's ¥30,222 million equates to 23.2% of the ¥130,000 million full-year plan, which the company left unrevised.
An electricity and gas retailer and busier chemicals trading drove the 39% revenue rise
Management attributed the increase to two developments. In Energy & Total Infrastructure, an electricity and gas retail business was brought into the consolidation as a subsidiary and energy-saving-related transactions grew; in Chemicals, trading volumes across a range of chemical products rose and market prices moved higher. The segment figures bear that out. Energy & Total Infrastructure revenue nearly tripled to ¥191,078 million from ¥67,630 million — the single largest contribution to the group's ¥235,348 million revenue increase — and Chemicals rose to ¥190,108 million from ¥143,351 million. Metals, Mineral Resources & Recycling climbed to ¥131,813 million from ¥87,813 million, Automotive to ¥104,151 million from ¥97,780 million, Retail & Consumer Service to ¥80,494 million from ¥65,517 million and Aerospace & Transportation Infrastructure to ¥21,586 million from ¥16,542 million. Consumer Industry & Agriculture Business was the only reporting segment to shrink, to ¥101,359 million from ¥108,942 million. Together the seven segments generated ¥820,592 million against ¥587,578 million. Sojitz reorganised its reporting structure on April 1, 2026 — renaming "Aerospace & Social Infrastructure" as Aerospace & Transportation Infrastructure and "Energy & Healthcare" as Energy & Total Infrastructure, and shifting some business areas between five of the segments — and has restated the prior-year comparatives on the new basis.
Chemicals almost doubled its profit; coking coal was the weak spot
On profit attributable to owners of the parent, five of the seven segments improved. Chemicals almost doubled to ¥11,053 million from ¥5,832 million — a ¥5,221 million swing, the largest of any segment — which the company credited to higher methanol prices, the profit contribution of Nippon A&L and firm trading both in Japan and overseas. Retail & Consumer Service added ¥3,400 million to reach ¥4,307 million on tobacco trading and strong progress at its Vietnamese foodservice wholesale business. Energy & Total Infrastructure gained ¥2,489 million to ¥6,858 million, helped by the new consolidation of an Australian infrastructure development business and increased energy-saving-related transactions in the United States. Aerospace & Transportation Infrastructure rose ¥323 million to ¥3,391 million on the new consolidation of an Australian public-transport business and a higher volume of handovers at overseas industrial parks, and Automotive narrowed its loss to ¥344 million from ¥449 million following the previous year's withdrawal from a loss-making business and continued earnings from Latin American vehicle sales. Two segments went backwards: Metals, Mineral Resources & Recycling fell ¥971 million to ¥2,130 million, chiefly on weak production efficiency at its Australian coking coal operation, and Consumer Industry & Agriculture Business fell ¥800 million to ¥2,652 million after low rainfall delayed planting and reduced handling volumes at its overseas fertiliser business. The seven segments totalled ¥30,048 million against ¥20,281 million, with the "Other" category and consolidation adjustments accounting for the small difference to the reported ¥30,222 million.
Equity-method income and restrained overheads widened the profit line
Profit before tax grew far faster than revenue because the cost base moved much less. Gross profit rose ¥29,105 million, or 35.4%, to ¥111,347 million, while selling, general and administrative expenses rose only ¥12,792 million, or 18.2%, to ¥83,025 million. The share of profit of investments accounted for using the equity method added ¥14,059 million against ¥10,803 million, a 30.1% increase that management cited alongside the gross-profit gain as the reason pre-tax profit rose 64.8%. Finance income climbed to ¥8,240 million from ¥6,739 million — interest income of ¥5,625 million, dividend income of ¥1,290 million and ¥1,324 million of other finance income — while finance costs rose to ¥9,367 million from ¥6,809 million, essentially all of it interest expense. Working the other way, net other income and expenses swung to a ¥135 million net charge from ¥2,204 million of net income, largely because gains on the reorganisation of affiliated companies fell to ¥3 million from ¥1,805 million and impairment losses on fixed assets rose to ¥695 million from ¥2 million. Income tax expense of ¥8,760 million, against ¥2,991 million, lifted the effective rate to 21.3% from 12.0% and left quarterly profit at ¥32,357 million, of which ¥2,134 million — against ¥875 million — went to non-controlling interests.
Comprehensive income of ¥76.6 billion ran at 2.4 times quarterly profit
The most arresting line in the statement never touches the income statement. Total comprehensive income reached ¥76,602 million against ¥4,302 million a year earlier, and the portion attributable to owners of the parent ¥71,689 million against ¥4,314 million — roughly 2.4 times the ¥32,357 million of quarterly profit. The entire gap is other comprehensive income, which came to ¥44,245 million after tax against a negative ¥17,652 million, a ¥61,897 million swing generated outside profit or loss. Two items account for most of it: net gains on financial assets measured at fair value through other comprehensive income of ¥18,760 million against ¥3,453 million, and the currency translation of foreign operations, which turned to a positive ¥16,533 million from a negative ¥14,826 million — a ¥31,359 million reversal in its own right. Cash flow hedges contributed ¥4,873 million against ¥2,159 million, the equity-method share of other comprehensive income ¥3,006 million in items that may later be reclassified to profit or loss (against a negative ¥7,265 million) and ¥1,191 million in items that will not (against a negative ¥1,120 million), while remeasurement of defined benefit plans cost ¥118 million. Because these are fair-value and translation movements rather than trading results, none of them supports the earnings-per-share figure.
Total assets passed ¥3.73 trillion as new equity-accounted investments were added
Total assets ended the quarter at ¥3,730,422 million, up ¥82,399 million from the March year-end, which the company attributed mainly to an increase in investments accounted for using the equity method following new acquisitions; that line rose to ¥751,050 million from ¥700,784 million. Total liabilities rose ¥22,001 million to ¥2,516,224 million as new funding lifted interest-bearing debt, with bonds and borrowings in non-current liabilities rising to ¥1,038,938 million from ¥996,142 million and the current portion to ¥381,581 million from ¥299,474 million. Equity attributable to owners of the parent rose ¥54,353 million to ¥1,144,722 million despite the dividend payment, on the accumulation of quarterly profit, and the owners' equity ratio improved to 30.7% from 29.9%. Net interest-bearing debt — total interest-bearing debt less cash, cash equivalents and time deposits, excluding lease liabilities — rose ¥131,537 million to ¥1,171,103 million, for a net debt-to-equity ratio of 1.02 times. The current ratio stood at 157.7% and the long-term funding ratio at 73.1%. Sojitz also holds long-term commitment lines of ¥100.0 billion, entirely undrawn, and US$2.475 billion, of which US$1.981 billion was drawn.
Operating cash flow swung to a ¥57.3 billion outflow as payables fell
Operating activities used ¥57,279 million against just ¥726 million a year earlier — a ¥56,553 million increase in outflow — as a rise in working capital outweighed operating receipts and dividends received. Trade and other payables fell ¥112,475 million and inventories rose ¥13,600 million, more than offsetting a ¥42,123 million reduction in trade and other receivables; dividends received of ¥16,089 million and interest received of ¥3,066 million partly cushioned ¥12,627 million of income taxes and ¥9,202 million of interest paid. Investing activities used ¥41,917 million, ¥12,516 million less than a year earlier, principally for an investment in a financial-solutions business — purchases of investments took ¥46,946 million and property, plant and equipment ¥7,058 million, against ¥9,545 million of long-term loan collections, ¥5,424 million from sales of investments and a ¥4,332 million net decrease in short-term loans. Financing activities provided ¥93,574 million, ¥34,336 million more than a year earlier, as borrowings outweighed dividends and lease repayments: long-term borrowings raised ¥402,811 million against ¥327,126 million of repayments, short-term debt and commercial paper added ¥38,068 million, dividends paid took ¥17,271 million, payments to non-controlling shareholders ¥1,764 million and lease liability repayments ¥4,783 million. Cash and cash equivalents ended the quarter at ¥242,105 million, down from ¥245,145 million at the March year-end after a ¥2,583 million positive translation adjustment.
Full-year plan left untouched — and Sojitz publishes no revenue forecast at all
The company kept its full-year guidance unchanged, stating explicitly that there has been no revision to the most recently announced forecast. On the summary page it guides only the bottom line: profit attributable to owners of the parent of ¥130,000 million, up 25.5% on the prior year, for basic earnings per share of ¥622.55. No revenue forecast is published anywhere in the report — the attached materials add a gross profit outlook of ¥440.0 billion, profit before tax of ¥170.0 billion and net profit of ¥135.0 billion, all on an assumed exchange rate of ¥150 to the US dollar, but the revenue line is simply not guided. Measured against those figures, the first quarter delivered 25.3% of the gross profit plan, 24.2% of the pre-tax plan, 24.0% of the net profit plan and 23.2% of the plan for profit attributable to owners — a first quarter running close to, but marginally behind, a straight-line quarter. On dividends, Sojitz confirmed an annual ¥180.00 per share for the year to March 2027, split ¥90.00 interim and ¥90.00 year-end, against ¥165.00 paid for the year to March 2026 (¥82.50 and ¥82.50), with no revision to the previously announced forecast; the ¥90.00 interim was resolved at the board meeting of May 1, 2026, for holders of record on September 30, 2026. The policy behind it, set out in Medium-Term Management Plan 2026, allocates roughly 30% of cumulative three-year basic operating cash flow to shareholder returns and applies a progressive dividend based on a 4.5% return on shareholders' equity. Shares issued stood unchanged at 210,000,000, treasury shares at 1,933,474 against 1,939,759 at the year-end — including 1,278,410 held by an officer remuneration BIP trust — and the weighted-average count used for earnings per share fell to 208,828,511 from 210,162,271. There were no material changes to the scope of consolidation and no changes to accounting policies or estimates, no going-concern note was required, and the quarterly financial statements were not subject to review by a certified public accountant or audit corporation.
| Metric | Q1 FY3/2027 | Q1 FY3/2026 | YoY |
|---|---|---|---|
| Revenue (¥ million) | 834,249 | 598,901 | +39.3% |
| Gross profit (¥ million) | 111,347 | 82,242 | +35.4% |
| SG&A expenses (¥ million) | 83,025 | 70,233 | +18.2% |
| Share of profit of equity-method investees (¥ million) | 14,059 | 10,803 | +30.1% |
| Profit before tax (¥ million) | 41,117 | 24,946 | +64.8% |
| Quarterly profit (¥ million) | 32,357 | 21,954 | +47.4% |
| Profit attributable to owners of parent (¥ million) | 30,222 | 21,079 | +43.4% |
| Basic EPS (¥) | 144.72 | 100.30 | +44.3% |
| Diluted EPS (¥) | 144.72 | 100.30 | +44.3% |
| Total comprehensive income (¥ million) | 76,602 | 4,302 | ×17.8 |
| Segment profit — Chemicals (¥ million) | 11,053 | 5,832 | +5,221 |
| Segment profit — Energy & Total Infrastructure (¥ million) | 6,858 | 4,369 | +2,489 |
| Segment profit — Retail & Consumer Service (¥ million) | 4,307 | 907 | +3,400 |
| Segment profit — Aerospace & Transportation Infrastructure (¥ million) | 3,391 | 3,068 | +323 |
| Segment profit — Consumer Industry & Agriculture Business (¥ million) | 2,652 | 3,452 | −800 |
| Segment profit — Metals, Mineral Resources & Recycling (¥ million) | 2,130 | 3,101 | −971 |
| Segment profit — Automotive (¥ million) | −344 | −449 | +105 |
| Operating cash flow (¥ million) | −57,279 | −726 | −56,553 |
| Investing cash flow (¥ million) | −41,917 | −54,433 | +12,516 |
| Financing cash flow (¥ million) | 93,574 | 59,238 | +34,336 |
| Cash and cash equivalents (¥ million, vs FY3/26 year-end) | 242,105 | 245,145 | −1.2% |
| Total assets (¥ million, vs FY3/26 year-end) | 3,730,422 | 3,648,023 | +2.3% |
| Total equity (¥ million, vs FY3/26 year-end) | 1,214,198 | 1,153,800 | +5.2% |
| Equity attributable to owners (¥ million, vs FY3/26 year-end) | 1,144,722 | 1,090,369 | +5.0% |
| Owners' equity ratio (%, vs FY3/26 year-end) | 30.7 | 29.9 | +0.8 pt |
| Net interest-bearing debt (¥ million, vs FY3/26 year-end) | 1,171,103 | 1,039,566 | +12.7% |
| FY3/27 guidance — gross profit (¥ million, vs Q1 actual) | 440,000 | 111,347 | Q1 = 25.3% |
| FY3/27 guidance — profit before tax (¥ million, vs Q1 actual) | 170,000 | 41,117 | Q1 = 24.2% |
| FY3/27 guidance — profit attributable to owners (¥ million, vs Q1 actual) | 130,000 | 30,222 | Q1 = 23.2% |
| FY3/27 guidance — basic EPS (¥) | 622.55 | — | +25.5% (full year) |
| Annual dividend (¥, FY3/27 forecast vs FY3/26 actual) | 180.00 | 165.00 | +9.1% |
JapanStockPulse provides informational content only and does not constitute investment advice. Figures are taken from the company's published earnings short report and may be subject to subsequent revision.