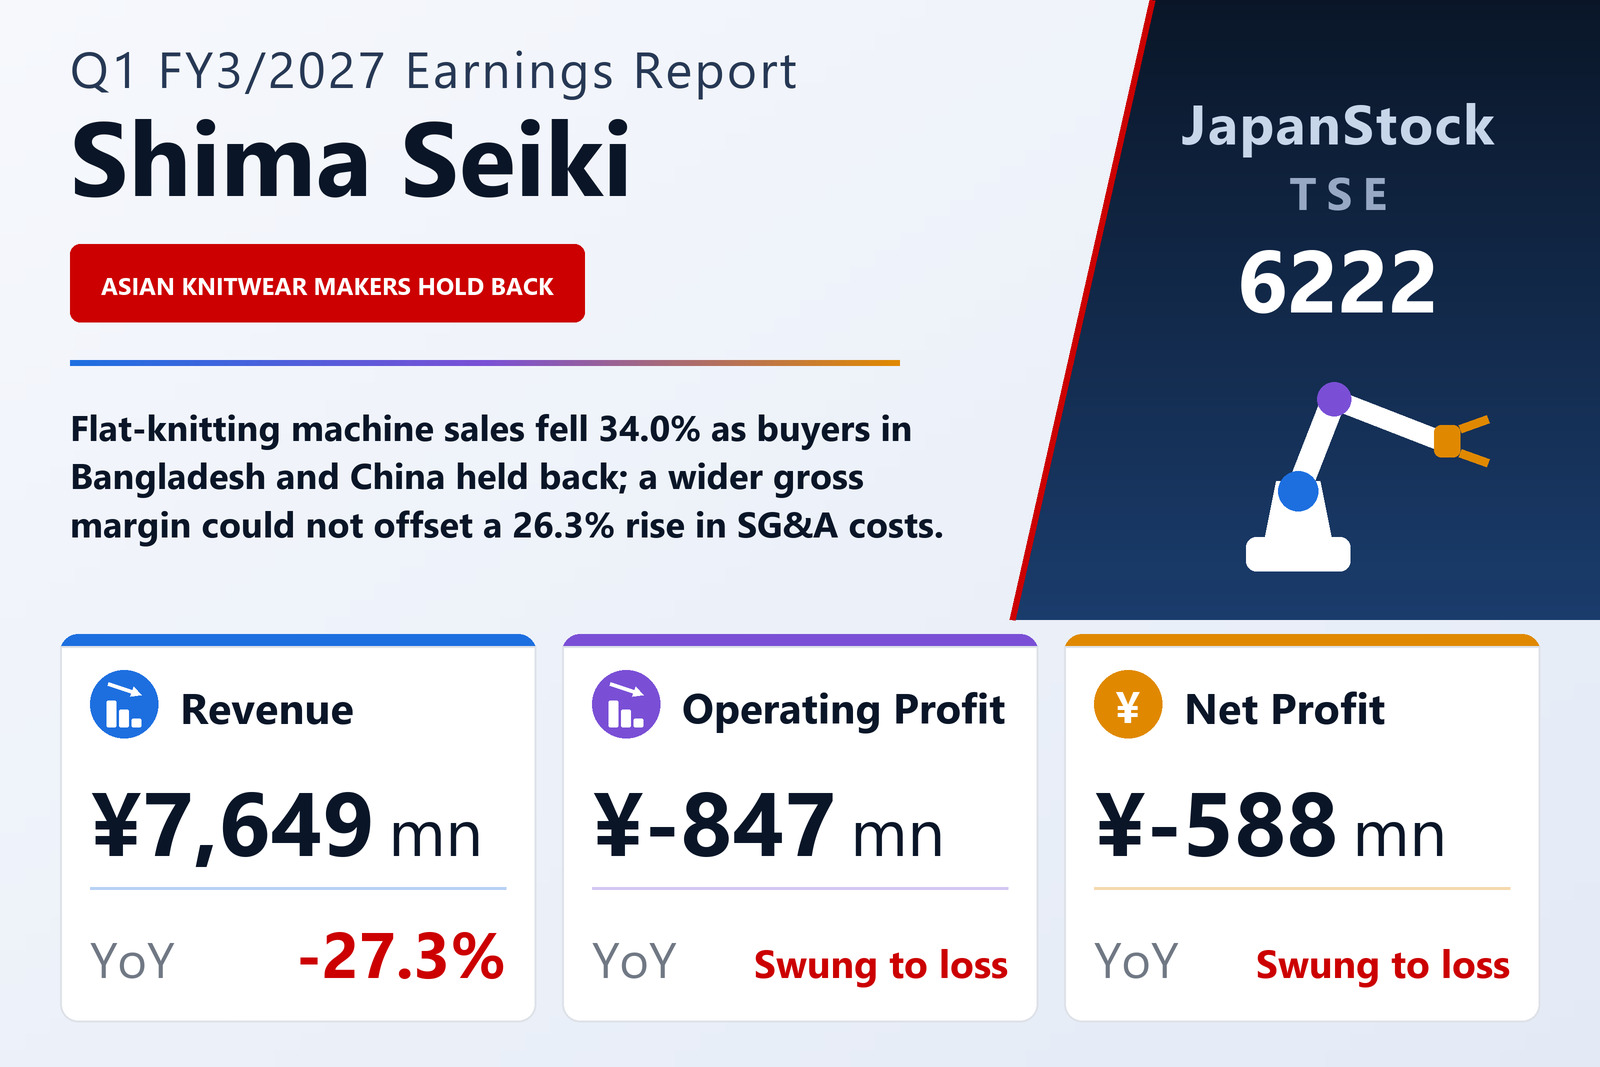
Revenue fell 27.3% and operating, ordinary and net profit all turned to losses
Shima Seiki Mfg., Ltd. (TSE: 6222), the maker of computerized flat knitting machines, published consolidated first-quarter results for FY3/2027 on July 31, 2026, covering April 1 to June 30, 2026 under Japanese GAAP. Revenue fell 27.3% to ¥7,649 million from ¥10,519 million, and the group swung to an operating loss of ¥847 million from an operating profit of ¥307 million a year earlier. Ordinary profit of ¥1,012 million became an ordinary loss of ¥500 million, and profit attributable to owners of the parent of ¥907 million became a loss of ¥588 million, or ¥17.35 per share against earnings of ¥26.36.
A better gross margin, overwhelmed by lower volume and higher overheads
The filing says the gross margin improved, and the statements bear that out. Cost of sales fell 36.4% to ¥4,462 million, faster than revenue, so gross profit slipped only 9.0% to ¥3,187 million and the gross margin widened from 33.3% to 41.7%. What turned the quarter into a loss was the other side of the ledger: selling, general and administrative expenses rose 26.3% to ¥4,035 million from ¥3,195 million, an increase of ¥840 million in a quarter when gross profit fell by ¥315 million. In the segment reconciliation, corporate expenses — mainly general and administrative costs and research and development not allocated to any segment — grew from ¥1,212 million to ¥1,740 million. The filing does not break down the SG&A increase or say what drove it.
Below the operating line the cushion was thinner than a year earlier. Non-operating income fell from ¥763 million to ¥430 million, chiefly because the foreign-exchange gain shrank from ¥453 million to ¥111 million, while interest expense rose from ¥26 million to ¥80 million. Neither quarter carried extraordinary items, so the pre-tax loss equalled the ordinary loss of ¥500 million; after ¥87 million of income taxes the quarterly net loss was ¥587 million, of which ¥588 million was attributable to owners of the parent. Comprehensive income was nonetheless positive at ¥752 million, up 28.3%, because a ¥675 million rise in unrealized gains on securities and a ¥652 million foreign-currency translation gain more than offset the loss.
Asian buyers held back; Italian luxury knitwear held up
The core Flat Knitting Machines segment, about 70% of revenue, fell 34.0% to ¥5,317 million from ¥8,054 million, and its segment profit fell 41.7% to ¥554 million from ¥951 million. The filing's explanation is specific. In Bangladesh and China, the main Asian markets, competition intensified and customers were cautious about capital spending, so unit sales fell. A cost-performance model of the company's shaping machines is being readied for a full rollout from the second half, and its unit sales in the quarter were limited. In Europe, demand for high-value knitwear, mainly for luxury brands, stayed firm in Italy and unit sales of shaping machines rose — but not by enough to offset Asia.
Revenue by customer location shows the same picture. Sales to Asia fell 51.7% to ¥2,875 million from ¥5,953 million, cutting the region's share of group revenue from 56.6% to 37.6%, and sales to the Middle East fell 63.1% to ¥268 million from ¥726 million. Europe rose 28.5% to ¥2,446 million from ¥1,903 million, and other regions rose to ¥588 million from ¥435 million, while Japan was little changed at ¥1,470 million against ¥1,500 million. The filing gives no separate reason for the Middle East decline.
Design systems and glove-and-sock machines fell with the core business
Design Systems revenue fell 20.4% to ¥558 million from ¥701 million, and segment profit fell 83.5% to ¥29 million from ¥176 million. The filing says the APEXFiz design software and the P-CAM automatic cutting machines sold in line with last year, but sales of the SDS-ONE APEX system fell alongside the knitting machines. Glove and Sock Knitting Machines revenue dropped 89.3% to ¥21 million from ¥196 million, and the segment posted a loss of ¥11 million against a profit of ¥25 million. The Other business — mainly parts for the knitting machines and design systems, and repair and maintenance — was the only one to grow, with revenue up 11.8% to ¥1,752 million, though its profit fell 12.8% to ¥319 million.
Orders offer a steadier signal than sales. For the three reporting segments combined, first-quarter orders were ¥6,414 million, up 3.3%, and the order backlog at June 30 was ¥4,857 million, up 4.7%. Flat Knitting Machines orders were ¥5,532 million, essentially flat on the year, and Design Systems orders rose 33.1% to ¥827 million. Orders therefore exceeded those three segments' combined sales of ¥5,897 million in the quarter. The filing publishes only the rates of change, not the prior-year order amounts.
Cash and short-term borrowing both rose
Total assets rose 2.2% to ¥111,960 million from ¥109,531 million at March 31, 2026, mainly because cash and deposits increased to ¥25,194 million from ¥21,295 million. Liabilities rose ¥2,073 million to ¥29,222 million, chiefly on short-term borrowings, which grew to ¥9,100 million from ¥6,200 million; long-term borrowings fell to ¥5,001 million from ¥6,667 million. Trade receivables declined to ¥34,678 million from ¥36,893 million. Net assets edged up to ¥82,737 million, and the equity ratio slipped 1.3 points to 73.9%. The balance sheet also carries ¥11,214 million of claims in bankruptcy and reorganization within investments, against which a non-current allowance for doubtful accounts of ¥9,387 million is held. From this quarter the group also accounts for Innovation Factory under the equity method, which contributed a ¥7 million gain.
Guidance and dividend unchanged, with most of the year still to come
Shima Seiki left unchanged the FY3/2027 guidance it published on May 8, 2026: revenue of ¥41,000 million (+22.4%), operating profit of ¥300 million, ordinary profit of ¥1,000 million (+246.3%) and profit attributable to owners of the parent of ¥900 million (+5.1%), or ¥26.53 per share. The first quarter delivered 18.7% of guided revenue and an operating loss of ¥847 million, so reaching the target requires roughly ¥33,351 million of revenue and ¥1,147 million of operating profit in the remaining nine months. The filing points to the second-half rollout of the cost-performance shaping machine, and to a structural reform headquarters set up to improve earnings, which is reviewing development, procurement, manufacturing, and sales and service and bringing in outside talent. The current year is the final one of the Ever Onward 2026 medium-term plan.
The dividend forecast was also left unchanged at ¥10.00 at the interim and ¥10.00 at the year-end, for an annual ¥20.00, the same as in FY3/2026 — about 75% of the guided ¥26.53 of earnings per share.
| Metric | Q1 FY3/2027 | Q1 FY3/2026 | Change |
|---|---|---|---|
| Revenue (¥ million) | 7,649 | 10,519 | −27.3% |
| Gross profit (¥ million) | 3,187 | 3,502 | −9.0% |
| Gross margin | 41.7% | 33.3% | +8.4 pt |
| SG&A expenses (¥ million) | 4,035 | 3,195 | +26.3% |
| Operating profit (¥ million) | −847 | 307 | profit to loss |
| Ordinary profit (¥ million) | −500 | 1,012 | profit to loss |
| Net profit attrib. to owners of parent (¥ million) | −588 | 907 | profit to loss |
| Comprehensive income (¥ million) | 752 | 586 | +28.3% |
| EPS (¥) | −17.35 | 26.36 | profit to loss |
| Flat Knitting Machines — revenue (¥ million) | 5,317 | 8,054 | −34.0% |
| Flat Knitting Machines — segment profit (¥ million) | 554 | 951 | −41.7% |
| Design Systems — revenue (¥ million) | 558 | 701 | −20.4% |
| Design Systems — segment profit (¥ million) | 29 | 176 | −83.5% |
| Glove & Sock Knitting Machines — revenue (¥ million) | 21 | 196 | −89.3% |
| Glove & Sock Knitting Machines — segment profit (¥ million) | −11 | 25 | profit to loss |
| Other — revenue (¥ million) | 1,752 | 1,567 | +11.8% |
| Other — segment profit (¥ million) | 319 | 366 | −12.8% |
| Orders received (¥ million) | 6,414 | — | +3.3% |
| Order backlog (¥ million) | 4,857 | — | +4.7% |
| Total assets (¥ million) | 111,960 | 109,531 | +2.2% |
| Net assets (¥ million) | 82,737 | 82,382 | +0.4% |
| Equity ratio | 73.9% | 75.2% | −1.3 pt |
| FY3/2027 guidance — revenue (¥ million) | 41,000 | — | +22.4% |
| FY3/2027 guidance — operating profit (¥ million) | 300 | — | n.m. |
| FY3/2027 guidance — ordinary profit (¥ million) | 1,000 | — | +246.3% |
| FY3/2027 guidance — net profit (¥ million) | 900 | — | +5.1% |
| FY3/2027 guidance — EPS (¥) | 26.53 | — | — |
| Annual dividend per share (¥) | 20.00 | 20.00 | unchanged |
JapanStockPulse provides informational content only and does not constitute investment advice. Figures are taken from the company's published earnings short report and may be subject to subsequent revision.