Every segment grew, and costs grew more slowly than sales
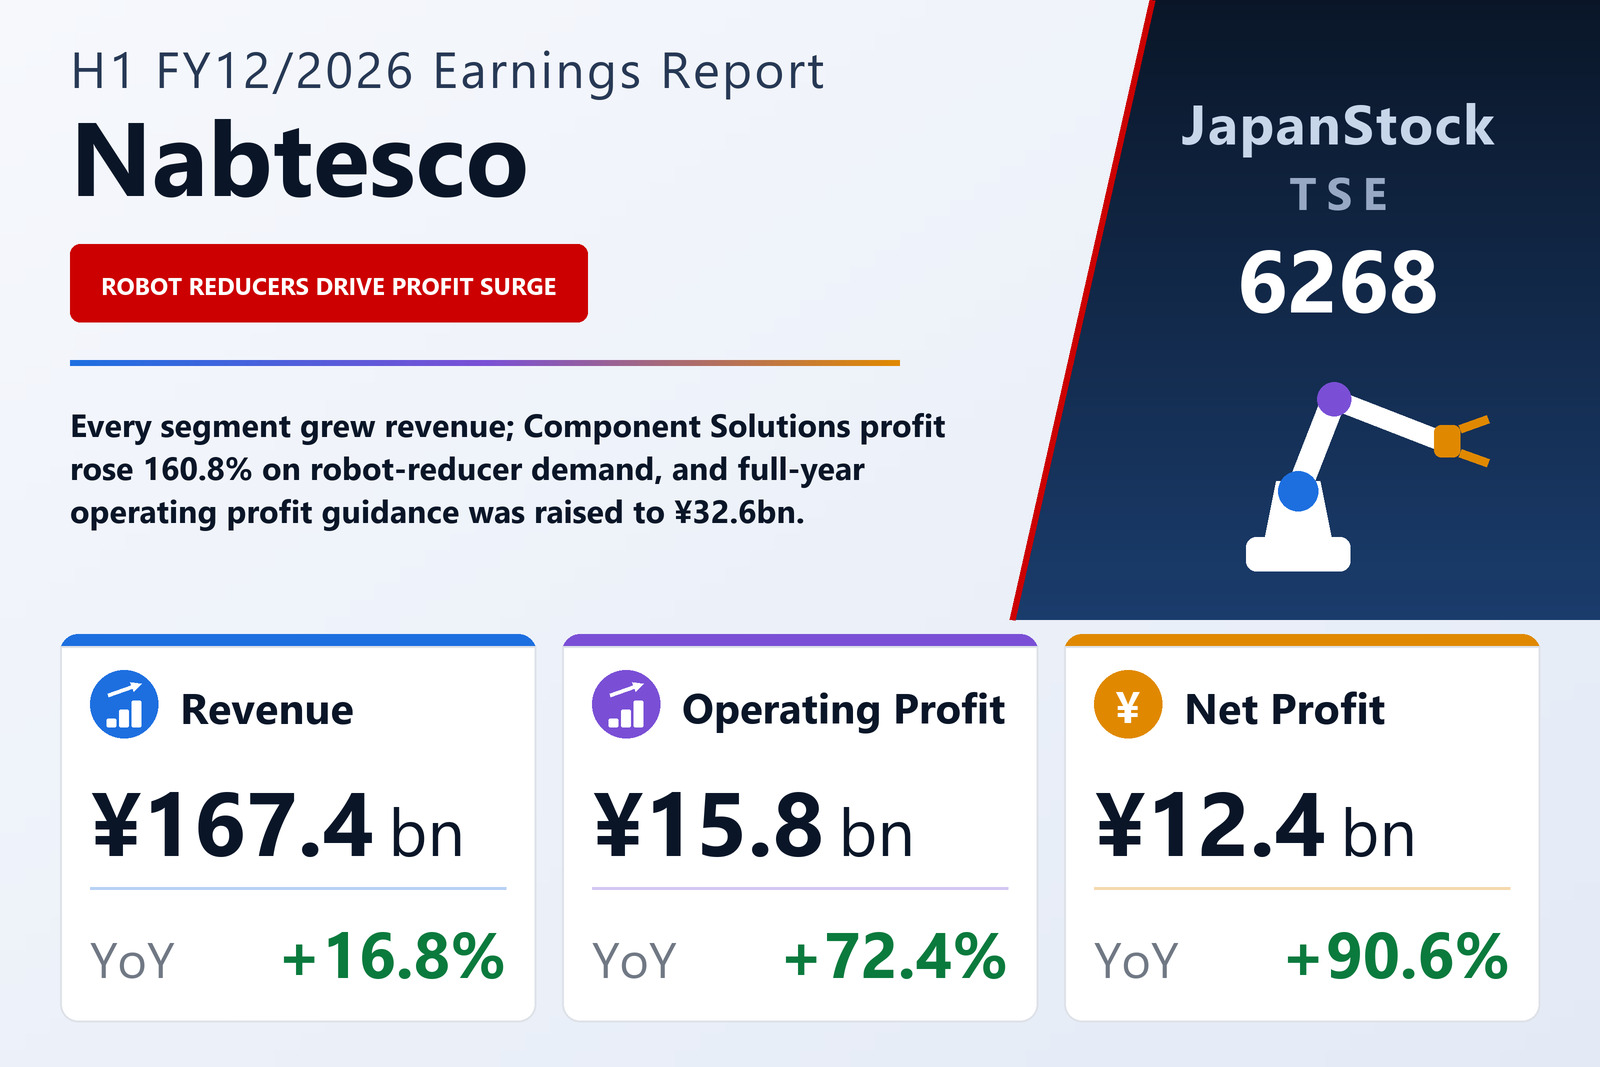
Nabtesco Corporation (TSE: 6268), whose businesses span precision reducers for industrial robots, brake and door systems for railway vehicles, aircraft and marine components, and automatic doors for buildings and station platforms, published consolidated first-half results for the six months from January 1 to June 30, 2026 on July 31, 2026 under IFRS. Revenue rose 16.8% to ¥167,401 million, operating profit 72.4% to ¥15,846 million, pre-tax profit 124.0% to ¥19,134 million and profit attributable to owners of the parent 90.6% to ¥12,416 million, for basic earnings of ¥105.94 per share against ¥54.20. Orders received rose 33.1% to ¥198,478 million, running well ahead of sales.
The operating arithmetic is straightforward. Cost of sales rose 14.7% to ¥115,180 million, slower than revenue, so gross profit grew 21.8% to ¥52,221 million and the gross margin widened from 29.9% to 31.2%. Selling, general and administrative expenses rose only 9.1% to ¥37,314 million, a little over half the rate of revenue growth, and other income of ¥1,376 million against other expenses of ¥438 million added a net ¥938 million, up from ¥546 million. The operating margin therefore moved from 6.4% to 9.5%. The filing attributes the gain to higher sales in the Component Solutions, Transport Solutions and Accessibility Solutions segments and to the effect of Project 10, its profitability-improvement programme.
The hydraulics sale reshapes the comparison
The year-on-year comparison is not like for like at every line. Under an agreement signed with Comer Industries S.p.A. on July 31, 2025, Nabtesco moved its hydraulic-equipment business into a newly formed wholly owned subsidiary, Comtesco, on December 31, 2025, and completed the transfer of 70% of Comtesco's shares on January 1, 2026; Comtesco is now an equity-method affiliate. Because the hydraulics business was classified as discontinued, the prior-year revenue, operating profit and pre-tax profit shown are for continuing operations only, while prior-year interim profit and profit attributable to owners include both continuing and discontinued operations. Three companies, including Comtesco and Nabtesco Power Control (Thailand) Co., Ltd., left the scope of consolidation.
That matters most for the bottom line. The prior-year ¥6,513 million attributable to owners included ¥709 million from the discontinued business; against the continuing-only ¥5,804 million, this year's ¥12,416 million is a rise of about 113.9% rather than the reported 90.6%. On the same basis, basic earnings per share from continuing operations rose from ¥48.30 to ¥105.94.
Below operating profit, equity-method income adds ¥3,177 million
Pre-tax profit rose by ¥10,591 million to ¥19,134 million, a far larger step than at the operating line. Finance income was ¥749 million against ¥223 million, mainly foreign-exchange gains, and finance costs, mainly interest, were ¥637 million against ¥833 million. The largest single swing was the share of profit of equity-method investments: ¥3,177 million against a loss of ¥40 million. The filing does not say which affiliates produced it. Income taxes were ¥6,186 million against ¥2,408 million, leaving profit from continuing operations of ¥12,949 million against ¥6,135 million, of which ¥533 million belonged to non-controlling interests. Comprehensive income was ¥18,187 million against ¥5,112 million, helped by foreign-currency translation differences of +¥2,917 million against −¥3,036 million a year earlier and a ¥2,322 million gain on financial assets measured at fair value through other comprehensive income.
Robot reducers lead the profit gain; Transport earns the most
Component Solutions grew revenue 23.6% to ¥45,521 million and segment profit 160.8% to ¥4,841 million, the largest profit increase of any segment at ¥2,985 million, on orders up 26.0% to ¥47,990 million. The filing says demand for precision reducers was strong for industrial robots, mainly for automakers in China and South Korea, and for general industry. Transport Solutions remained the largest profit earner: revenue ¥54,422 million, up 17.1%, segment profit ¥9,349 million, up 31.8%, and orders up 52.8% to ¥78,420 million. Within it, marine equipment sales rose sharply on demand for new ships, mainly in China, and for maintenance, repair and overhaul; aircraft equipment rose on commercial-aircraft demand; commercial-vehicle equipment rose as the domestic market recovered gradually; and railway-vehicle equipment was flat, as steady domestic and Chinese subway demand offset lower European sales following the sale of a European subsidiary.
Accessibility Solutions, the automatic-door business, grew revenue 12.2% to ¥58,998 million and segment profit 33.6% to ¥5,675 million, on steady demand for overseas building doors and domestic platform doors plus a currency tailwind; orders rose 19.1% to ¥60,969 million. The Other segment, chiefly packaging machinery, grew revenue 14.3% to ¥8,459 million on capital spending by domestic food makers, but its profit fell 29.7% to ¥490 million, and the filing gives no reason for the decline. Unallocated corporate costs narrowed to ¥4,510 million from ¥4,700 million. By customer location, sales rose 11.5% in Japan to ¥82,492 million, 17.7% in Europe to ¥32,987 million, 24.9% in China to ¥24,696 million and 27.0% in North America to ¥14,523 million.
The order book grew faster than sales. The period-end backlog stood at ¥211,132 million against ¥170,576 million a year earlier, with Transport Solutions accounting for ¥124,197 million of it, up from ¥96,207 million.
Sale proceeds lift cash and retire long-term debt
Total assets fell 1.7% to ¥455,904 million from ¥463,991 million at December 31, 2025, mainly because ¥43,665 million of assets held for sale left the balance sheet with the hydraulics business and trade receivables fell by ¥9,658 million. Against that, cash and cash equivalents rose by ¥26,243 million to ¥99,583 million, equity-method investments by ¥10,414 million and inventories by ¥5,031 million. Liabilities fell by ¥15,608 million to ¥159,549 million: non-current borrowings dropped from ¥10,039 million to ¥30 million while current borrowings rose from ¥34,946 million to ¥43,397 million. Equity attributable to owners of the parent grew by ¥12,552 million to ¥284,484 million, lifting the equity ratio from 58.6% to 62.4%.
Operating cash flow was ¥22,029 million against ¥20,327 million. Investing activities brought in ¥11,476 million, against an outflow of ¥10,253 million a year earlier, chiefly because of ¥18,204 million of proceeds from selling shares in subsidiaries; spending on property, plant and equipment fell to ¥2,400 million from ¥7,020 million. Free cash flow was therefore ¥33,505 million against ¥10,074 million. Financing activities used ¥8,460 million, mainly for dividends.
Guidance raised, dividend held, and a buyback of up to ¥15 billion
Nabtesco raised its full-year FY12/2026 guidance from the figures published on April 30, 2026. It now expects revenue of ¥344,000 million (from ¥327,000 million; +11.7% on FY12/2025), operating profit of ¥32,600 million (from ¥27,700 million; +57.3%), pre-tax profit of ¥36,300 million (from ¥28,600 million; +67.6%) and profit attributable to owners of ¥24,100 million (from ¥18,600 million; +53.6%), for earnings per share of ¥206.20 against ¥158.72 previously. The filing cites rising demand for precision reducers, automatic doors and marine equipment and a currency effect for the revenue increase, and higher sales, expense restraint and higher equity-method income for the profit lines. The biggest segment revision is in Component Solutions, whose operating-profit forecast rose from ¥7,000 million to ¥9,700 million. The first half delivered 48.7% of the new revenue forecast and 48.6% of the operating-profit forecast, implying second-half operating profit of about ¥16,754 million, slightly above the first.
The dividend forecast is unchanged: an interim dividend of ¥41.00, payable from August 31, 2026, and a forecast year-end ¥41.00, for an annual ¥82.00 against ¥80.00. As a subsequent event, the board resolved on July 31, 2026 to buy back up to 4 million shares (3.40% of shares outstanding excluding treasury stock) or ¥15 billion through market purchases on the Tokyo Stock Exchange between August 3 and November 30, 2026, and to cancel all shares acquired on December 15, 2026. The stated aim is to raise per-share shareholder value and improve capital efficiency.
| Metric | H1 FY12/2026 | H1 FY12/2025 | Change |
|---|---|---|---|
| Revenue (¥ million) | 167,401 | 143,272 | +16.8% |
| Gross profit (¥ million) | 52,221 | 42,863 | +21.8% |
| Gross margin | 31.2% | 29.9% | +1.3 pt |
| SG&A expenses (¥ million) | 37,314 | 34,215 | +9.1% |
| Operating profit (¥ million) | 15,846 | 9,194 | +72.4% |
| Operating margin | 9.5% | 6.4% | +3.1 pt |
| Pre-tax profit (¥ million) | 19,134 | 8,544 | +124.0% |
| Net profit attrib. to owners of parent (¥ million) | 12,416 | 6,513 | +90.6% |
| Comprehensive income (¥ million) | 18,187 | 5,112 | +255.8% |
| EPS (¥) | 105.94 | 54.20 | +95.5% |
| Orders received (¥ million) | 198,478 | 149,113 | +33.1% |
| Component Solutions — revenue (¥ million) | 45,521 | 36,821 | +23.6% |
| Component Solutions — segment profit (¥ million) | 4,841 | 1,856 | +160.8% |
| Transport Solutions — revenue (¥ million) | 54,422 | 46,467 | +17.1% |
| Transport Solutions — segment profit (¥ million) | 9,349 | 7,093 | +31.8% |
| Accessibility Solutions — revenue (¥ million) | 58,998 | 52,585 | +12.2% |
| Accessibility Solutions — segment profit (¥ million) | 5,675 | 4,247 | +33.6% |
| Other — revenue (¥ million) | 8,459 | 7,399 | +14.3% |
| Other — segment profit (¥ million) | 490 | 697 | −29.7% |
| Total assets (¥ million) | 455,904 | 463,991 | −1.7% |
| Equity attrib. to owners of parent (¥ million) | 284,484 | 271,932 | +4.6% |
| Equity ratio | 62.4% | 58.6% | +3.8 pt |
| FY12/2026 guidance — revenue (¥ million) | 344,000 | — | +11.7% |
| FY12/2026 guidance — operating profit (¥ million) | 32,600 | — | +57.3% |
| FY12/2026 guidance — pre-tax profit (¥ million) | 36,300 | — | +67.6% |
| FY12/2026 guidance — net profit (¥ million) | 24,100 | — | +53.6% |
| FY12/2026 guidance — EPS (¥) | 206.20 | — | +56.7% |
| Annual dividend per share (¥) | 82.00 | 80.00 | +2.5% |
JapanStockPulse provides informational content only and does not constitute investment advice. Figures are taken from the company's published earnings short report and may be subject to subsequent revision.