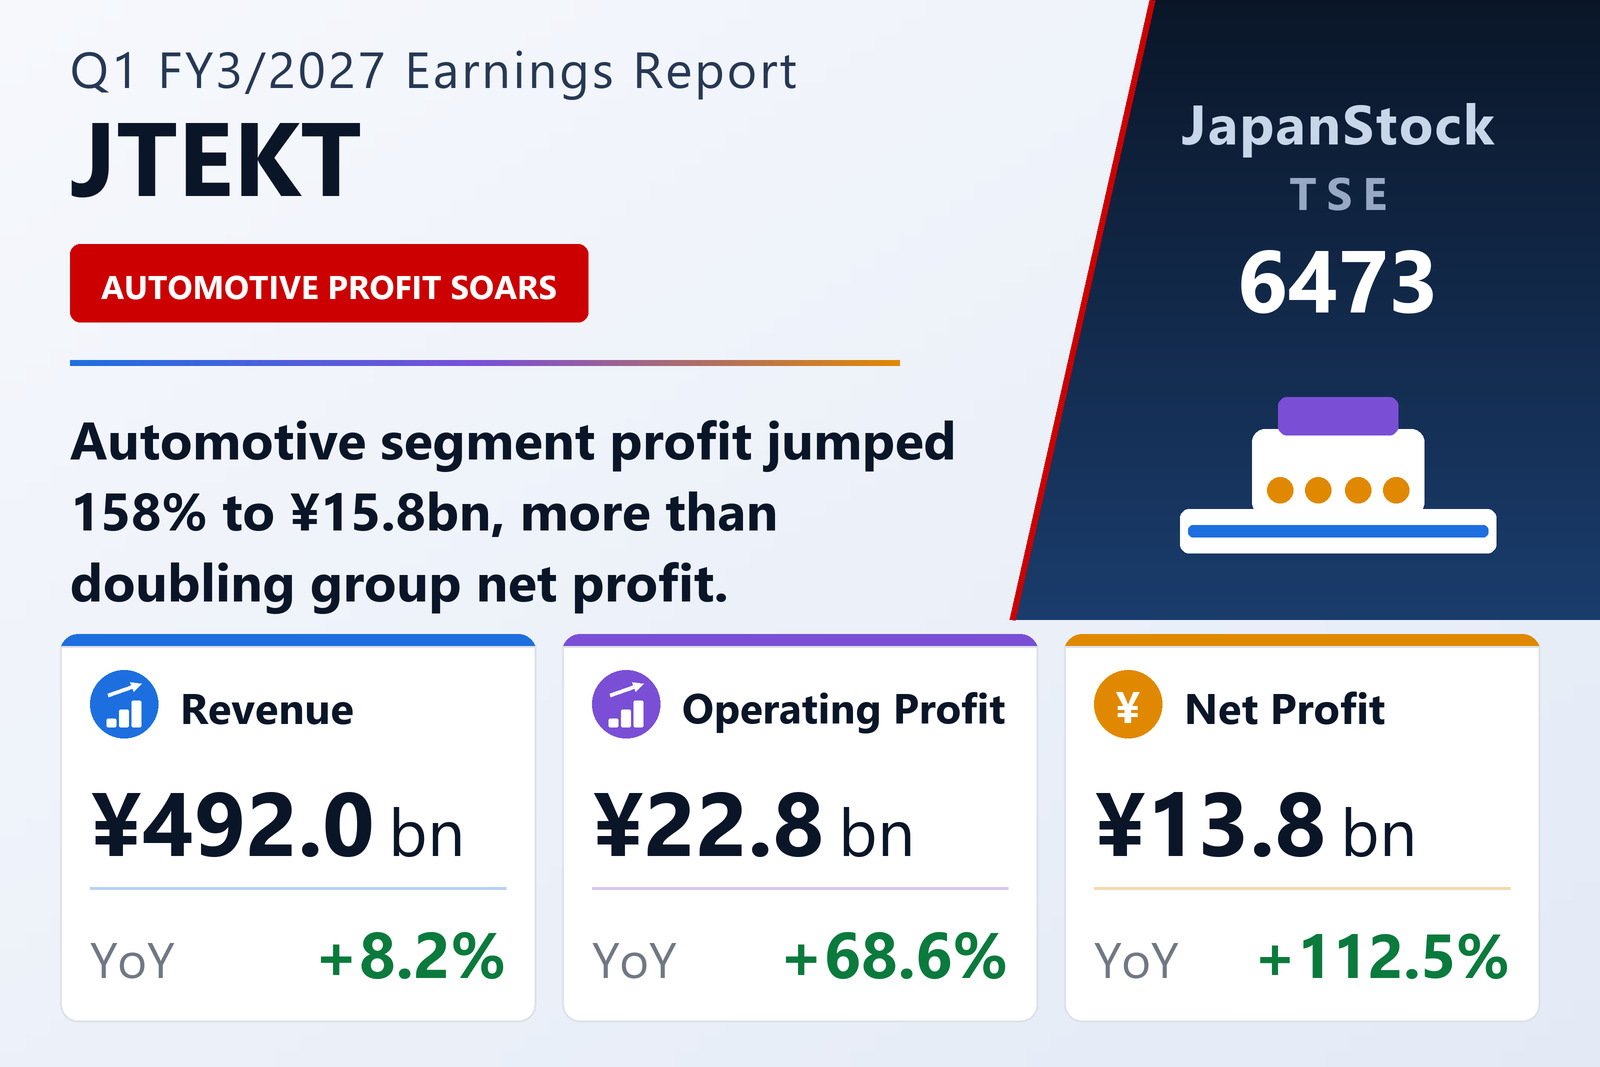
JTEKT Corporation (TSE: 6473), the Toyota-group manufacturer of steering systems, driveline components, bearings and machine tools, reported consolidated results for the first quarter of the year to March 2027 — the three months ended June 30, 2026 — under IFRS. Revenue rose 8.2% to ¥491,973 million. Business profit, which JTEKT defines as revenue less cost of sales and selling, general and administrative expenses, climbed 62.1% to ¥22,746 million, and operating profit rose 68.6% to ¥22,811 million. Profit before tax more than doubled, up 108.8% to ¥21,560 million, and profit attributable to owners of the parent rose 112.5% to ¥13,833 million. Basic earnings per share were ¥43.45 against ¥20.45 a year earlier; diluted EPS was ¥43.43 against ¥20.44.
Automotive does the heavy lifting
All three reporting segments grew revenue, but only one grew profit. Automotive — steering, driveline and related components — lifted revenue 9.7% to ¥355,287 million from ¥323,882 million and segment profit 158.1% to ¥15,762 million from ¥6,106 million. The company attributes the gain to a weaker yen and higher sales in Japan, North America and Asia, which more than offset lower volumes in China, with the profit swing driven by currency and cost-reduction work. Industrial machinery and bearings revenue edged up 2.4% to ¥88,169 million from ¥86,107 million despite the divestment of the European needle roller bearing business during the prior fiscal year, but segment profit fell 11.1% to ¥3,678 million from ¥4,140 million as U.S. tariffs outweighed the benefits of currency, cost reduction and structural reform. Machine tools revenue rose 8.3% to ¥48,516 million from ¥44,805 million on currency and stronger North American demand, while segment profit slipped 15.0% to ¥3,299 million from ¥3,879 million on higher costs.
Margins widen and finance costs shrink
Gross profit rose 19.4% to ¥82,525 million, lifting the gross margin to 16.8% from 15.2%, while SG&A grew a slower 8.5% to ¥59,779 million. That combination pushed the business-profit margin to 4.6% from 3.1%. Below the operating line, the net finance charge narrowed sharply to ¥1,205 million from ¥3,151 million — finance income of ¥2,205 million against costs of ¥3,410 million, versus ¥4,160 million and ¥7,311 million a year ago — which is what turned a 68.6% operating-profit gain into a 108.8% pre-tax gain. Income tax expense of ¥7,146 million represented an effective rate of 33.1%, little changed from 32.5%, and non-controlling interests took ¥580 million.
Guidance untouched despite a fast start
Management left the full-year FY3/2027 forecast published on April 28 completely unchanged: revenue of ¥1,880,000 million (−2.3%), business profit of ¥90,000 million (+18.9%), operating profit of ¥75,000 million (+201.8%), profit before tax of ¥70,000 million (+155.7%), profit attributable to owners of the parent of ¥50,000 million (+317.6%) and basic EPS of ¥157.07. The quarter already banks 30.4% of the full-year operating-profit target and 27.7% of the net-profit target, while annualising Q1 revenue would land roughly 4.7% above the guided top line. The headline tripling at the operating level says as much about the comparator as about this year: the guided percentages imply FY3/2026 operating profit of about ¥24.9 billion against business profit of about ¥75.7 billion, a gap of roughly ¥51 billion in net other expenses that this quarterly release does not break out. The forecast assumes ¥156 to the U.S. dollar and ¥181 to the euro for the first quarter, easing to ¥155 and ¥180 from the second quarter onward.
Dividend heading 17% higher
The dividend forecast was also left as previously announced. JTEKT plans an annual payout of ¥70.00 per share for FY3/2027 — ¥35.00 at the interim and ¥35.00 at year-end — up from ¥60.00 (¥30.00 plus ¥30.00) for FY3/2026, a 16.7% increase. Against guided EPS of ¥157.07 that implies a payout ratio of about 44.6%. The company had 318,608,107 shares issued at quarter-end, of which 264,824 were held in treasury, and a weighted average of 318,332,300 shares was used for the EPS calculation.
Balance sheet and cash flow
Total assets stood at ¥1,604,198 million at June 30, up ¥26,502 million from March 31, as cash and cash equivalents built to ¥168,471 million from ¥137,550 million while trade and other receivables fell. Liabilities rose ¥6,306 million to ¥758,772 million on higher bonds, borrowings and provisions, and total equity rose ¥20,195 million to ¥845,426 million; equity attributable to owners of the parent reached ¥809,376 million, an equity ratio of 50.5% against 50.1% three months earlier. Operating cash flow was ¥43,316 million (from ¥36,004 million), the investing outflow narrowed to ¥6,974 million (from ¥22,572 million), and financing was a ¥6,841 million outflow on dividend payments against a ¥5,780 million inflow a year ago — leaving free cash flow of roughly ¥36.3 billion versus ¥13.4 billion. Total comprehensive income swung to ¥29,366 million from a ¥8,222 million loss, helped by a ¥7,758 million foreign-currency translation gain and ¥6,433 million of gains on equity instruments designated at FVTOCI.
| Metric | Q1 FY3/2027 | Q1 FY3/2026 | YoY |
|---|---|---|---|
| Revenue (¥ billion) | 491.97 | 454.79 | +8.2% |
| Business profit (¥ billion) | 22.75 | 14.04 | +62.1% |
| Operating profit (¥ billion) | 22.81 | 13.53 | +68.6% |
| Profit before tax (¥ billion) | 21.56 | 10.32 | +108.8% |
| Profit for the period (¥ billion) | 14.41 | 6.96 | +107.0% |
| Profit attrib. to owners (¥ billion) | 13.83 | 6.51 | +112.5% |
| Total comprehensive income (¥ billion) | 29.37 | −8.22 | n.m. |
| Basic EPS (¥) | 43.45 | 20.45 | +112.5% |
| Diluted EPS (¥) | 43.43 | 20.44 | +112.5% |
| FY3/2027 operating profit guidance (¥ billion) | 75.00 | 24.85 | +201.8% |
| Annual dividend (¥) | 70.00 | 60.00 | +16.7% |
| Segment | Revenue (¥ billion) | YoY | Segment profit (¥ billion) | YoY |
|---|---|---|---|---|
| Automotive | 355.29 | +9.7% | 15.76 | +158.1% |
| Industrial machinery & bearings | 88.17 | +2.4% | 3.68 | −11.1% |
| Machine tools | 48.52 | +8.3% | 3.30 | −15.0% |
| Consolidated | 491.97 | +8.2% | 22.75 | +62.1% |
JapanStockPulse provides informational content only and does not constitute investment advice. Figures are taken from the company's published earnings short report and may be subject to subsequent revision.