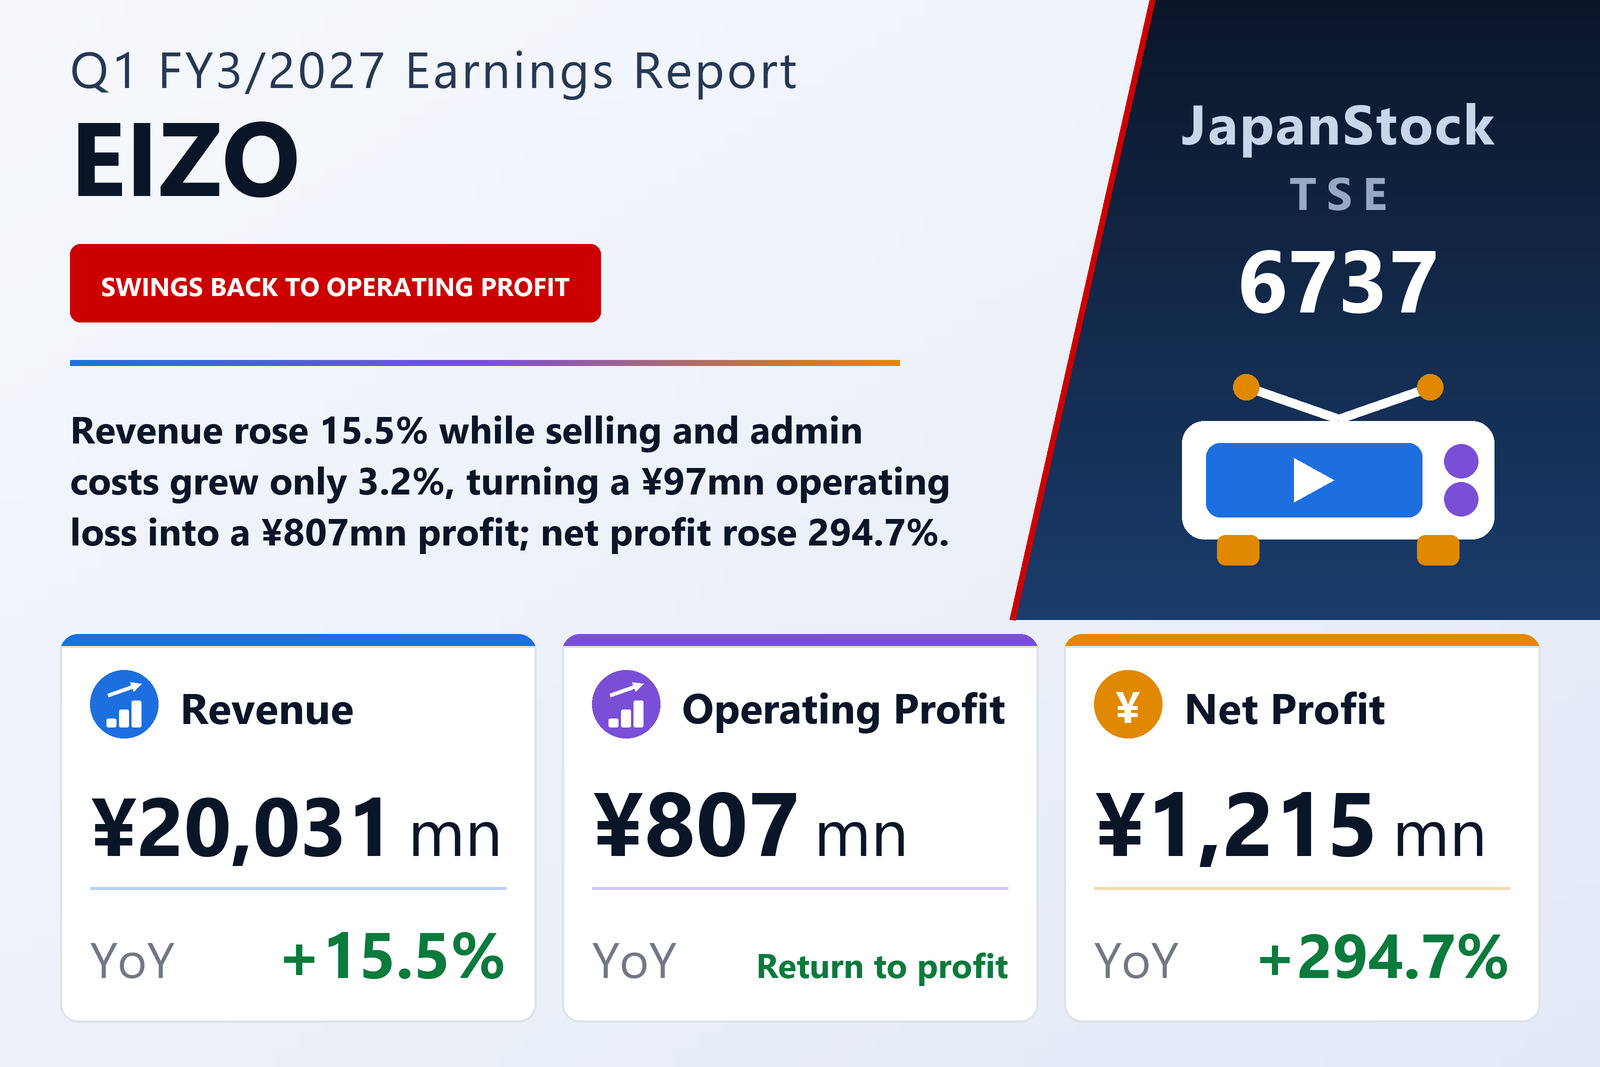
A ¥97 million operating loss becomes an ¥807 million profit
EIZO Corporation (TSE: 6737), which develops, produces and sells monitors and related visual-imaging products, published consolidated results under Japanese GAAP on July 31, 2026 for the first quarter of the fiscal year ending March 2027, the three months from April 1 to June 30, 2026. Revenue rose 15.5% to ¥20,031 million, and the operating line moved from a loss of ¥97 million to a profit of ¥807 million. Ordinary profit rose 129.0% to ¥1,574 million and profit attributable to owners of the parent 294.7% to ¥1,215 million, for earnings of ¥30.76 per share against ¥7.48. The filing names the Tokyo Stock Exchange as the company's listing.
The swing is straightforward arithmetic. Cost of sales rose 13.9% to ¥13,094 million, slower than revenue, so gross profit grew 18.8% to ¥6,937 million and the gross margin reached 34.6%, up 1.0 point by the company's own measure. EIZO attributes that to the higher sales and to a weaker yen against the euro. Selling, general and administrative expenses rose only 3.2% to ¥6,130 million. Gross profit therefore added ¥1,098 million while SG&A added ¥193 million, and the difference is almost exactly the ¥904 million improvement at the operating line. The operating margin went from −0.6% to 4.0%.
The filing explains why SG&A barely moved. Costs fell because of the restructuring and streamlining of the European organisation, which cut fixed costs, and because the one-off expenses for the new technology building booked in the prior-year quarter did not recur. Pulling the other way, the weaker yen raised the yen value of overseas subsidiaries' SG&A when translated. The company quantifies none of these three effects separately.
Dividend income carries ordinary profit
Non-operating income was little changed at ¥844 million against ¥853 million, but its make-up shifted. Dividends received rose to ¥732 million from ¥613 million and interest income to ¥13 million from ¥4 million, while the prior year's ¥159 million foreign-exchange gain was replaced by a foreign-exchange loss of less than ¥1 million. Non-operating expenses were ¥76 million, against ¥68 million. With the operating line back in profit, ordinary profit more than doubled to ¥1,574 million.
There were no extraordinary items in either quarter, so pre-tax profit equalled ordinary profit. Income taxes were ¥359 million against ¥379 million, leaving net profit of ¥1,215 million, all of it attributable to owners of the parent. Earnings per share rose faster than net profit because the average share count fell to 39,499,230 from 41,158,646.
Five of six markets grew, led by V&S and Amusement
EIZO reports a single business segment, visual equipment and related products, so the filing gives sales by market instead. Healthcare, the largest at 42.0% of revenue, rose 12.2% to ¥8,404 million: sales for diagnostic and endoscopy use recovered in Europe and North America and kept expanding in India and the Middle East, while Japan stayed soft as worsening finances at medical institutions held back capital spending. Operating-room demand was firm both overseas and in Japan. B&P (Business & Plus) rose 14.6% to ¥3,333 million, as an accumulation of deals lifted overseas sales although the European economy has not improved, and large projects added to sales in Japan.
V&S (Vertical & Specific) grew fastest among the larger markets, up 38.2% to ¥3,593 million. Air-traffic-control sales stayed firm in Europe and China and shipments for a large project began in North America; surveillance rose on firm sales in Japan; maritime fell on delivery timing despite continued strong shipbuilding demand; and defense benefited from strong sales of GPGPU computing boards developed and produced by the U.S. subsidiary, mainly in North America, plus higher monitor sales in Europe and Japan. Amusement, which supplies LCD monitors for pachinko and pachislot machines, rose 60.3% to ¥2,101 million, although the company describes the industry as shrinking with fewer players and fewer halls.
Two markets declined. Creative Work fell 4.9% to ¥1,093 million, with steady sales in Japan outweighed by weak sales in Europe and North America. Other fell 19.7% to ¥1,506 million on lower contract development of amusement software.
Securities gains add ¥89,670 million to total assets
The balance sheet grew sharply for a reason unrelated to trading. Total assets rose ¥89,670 million to ¥267,153 million from March 31, 2026, because the market prices of securities EIZO holds rose steeply: investment securities went from ¥64,442 million to ¥157,626 million. The matching entries were a rise in deferred tax liabilities to ¥43,491 million from ¥14,054 million and in the valuation difference on available-for-sale securities to ¥102,554 million from ¥38,631 million. That is why comprehensive income was ¥65,533 million against net profit of ¥1,215 million.
Net assets rose ¥62,923 million to ¥199,854 million and liabilities ¥26,746 million to ¥67,298 million, so the equity ratio slipped to 74.8% from 77.2% even as equity grew. Cash and deposits rose to ¥23,598 million from ¥20,352 million. EIZO did not prepare a quarterly cash-flow statement; depreciation was ¥734 million against ¥769 million. Treasury stock increased to ¥5,230 million from ¥4,770 million.
Guidance held; buyback ceiling raised to ¥17,000 million
EIZO left unchanged the full-year forecast it published on May 12, 2026: revenue of ¥85,000 million (+4.5%), operating profit of ¥3,300 million (+39.5%), ordinary profit of ¥4,600 million (+21.9%) and profit attributable to owners of the parent of ¥6,500 million (−11.2%), or ¥167.60 per share. The first quarter delivered 23.6% of the revenue forecast and 24.5% of the operating-profit forecast. This filing does not explain why net profit is forecast to fall while operating profit rises. The dividend forecast is also unchanged at ¥115.00 per share for the year, two payments of ¥57.50, against ¥110.00 for the previous year. The company notes that FY3/2027 is the final year of its eighth medium-term plan and that it has revised the plan's final-year numerical targets in light of changes in the business environment.
As a subsequent event, the board resolved on July 31, 2026 to enlarge the share buyback it had approved on May 12. The maximum number of shares rises from 1.5 million to 5.5 million, equal to 13.91% of shares outstanding excluding treasury stock, and the maximum amount from ¥4,000 million to ¥17,000 million. The purchase period is extended to May 24, 2027 from April 30, 2027, and the method now includes off-auction purchases through ToSTNeT-3 in addition to market purchases on the Tokyo Stock Exchange.
| Metric | Q1 FY3/2027 | Q1 FY3/2026 | Change |
|---|---|---|---|
| Revenue (¥ million) | 20,031 | 17,338 | +15.5% |
| Gross profit (¥ million) | 6,937 | 5,839 | +18.8% |
| Gross margin | 34.6% | 33.7% | +1.0 pt |
| SG&A expenses (¥ million) | 6,130 | 5,937 | +3.2% |
| Operating profit (¥ million) | 807 | −97 | loss to profit |
| Operating margin | 4.0% | −0.6% | +4.6 pt |
| Ordinary profit (¥ million) | 1,574 | 687 | +129.0% |
| Net profit attrib. to owners of parent (¥ million) | 1,215 | 307 | +294.7% |
| Comprehensive income (¥ million) | 65,533 | 374 | n.m. |
| EPS (¥) | 30.76 | 7.48 | +311.2% |
| B&P (Business & Plus) market — revenue (¥ million) | 3,333 | 2,909 | +14.6% |
| Healthcare market — revenue (¥ million) | 8,404 | 7,491 | +12.2% |
| Creative Work market — revenue (¥ million) | 1,093 | 1,149 | −4.9% |
| V&S (Vertical & Specific) market — revenue (¥ million) | 3,593 | 2,600 | +38.2% |
| Amusement market — revenue (¥ million) | 2,101 | 1,310 | +60.3% |
| Other — revenue (¥ million) | 1,506 | 1,876 | −19.7% |
| Total assets (¥ million) | 267,153 | 177,482 | +50.5% |
| Net assets (¥ million) | 199,854 | 136,930 | +46.0% |
| Equity ratio | 74.8% | 77.2% | −2.4 pt |
| FY3/2027 guidance — revenue (¥ million) | 85,000 | — | +4.5% |
| FY3/2027 guidance — operating profit (¥ million) | 3,300 | — | +39.5% |
| FY3/2027 guidance — ordinary profit (¥ million) | 4,600 | — | +21.9% |
| FY3/2027 guidance — net profit (¥ million) | 6,500 | — | −11.2% |
| FY3/2027 guidance — EPS (¥) | 167.60 | — | n.m. |
| Annual dividend per share (¥) | 115.00 | 110.00 | +4.5% |
JapanStockPulse provides informational content only and does not constitute investment advice. Figures are taken from the company's published earnings short report and may be subject to subsequent revision.