Flat revenue, a thinner gross margin and higher overheads pushed the quarter into the red
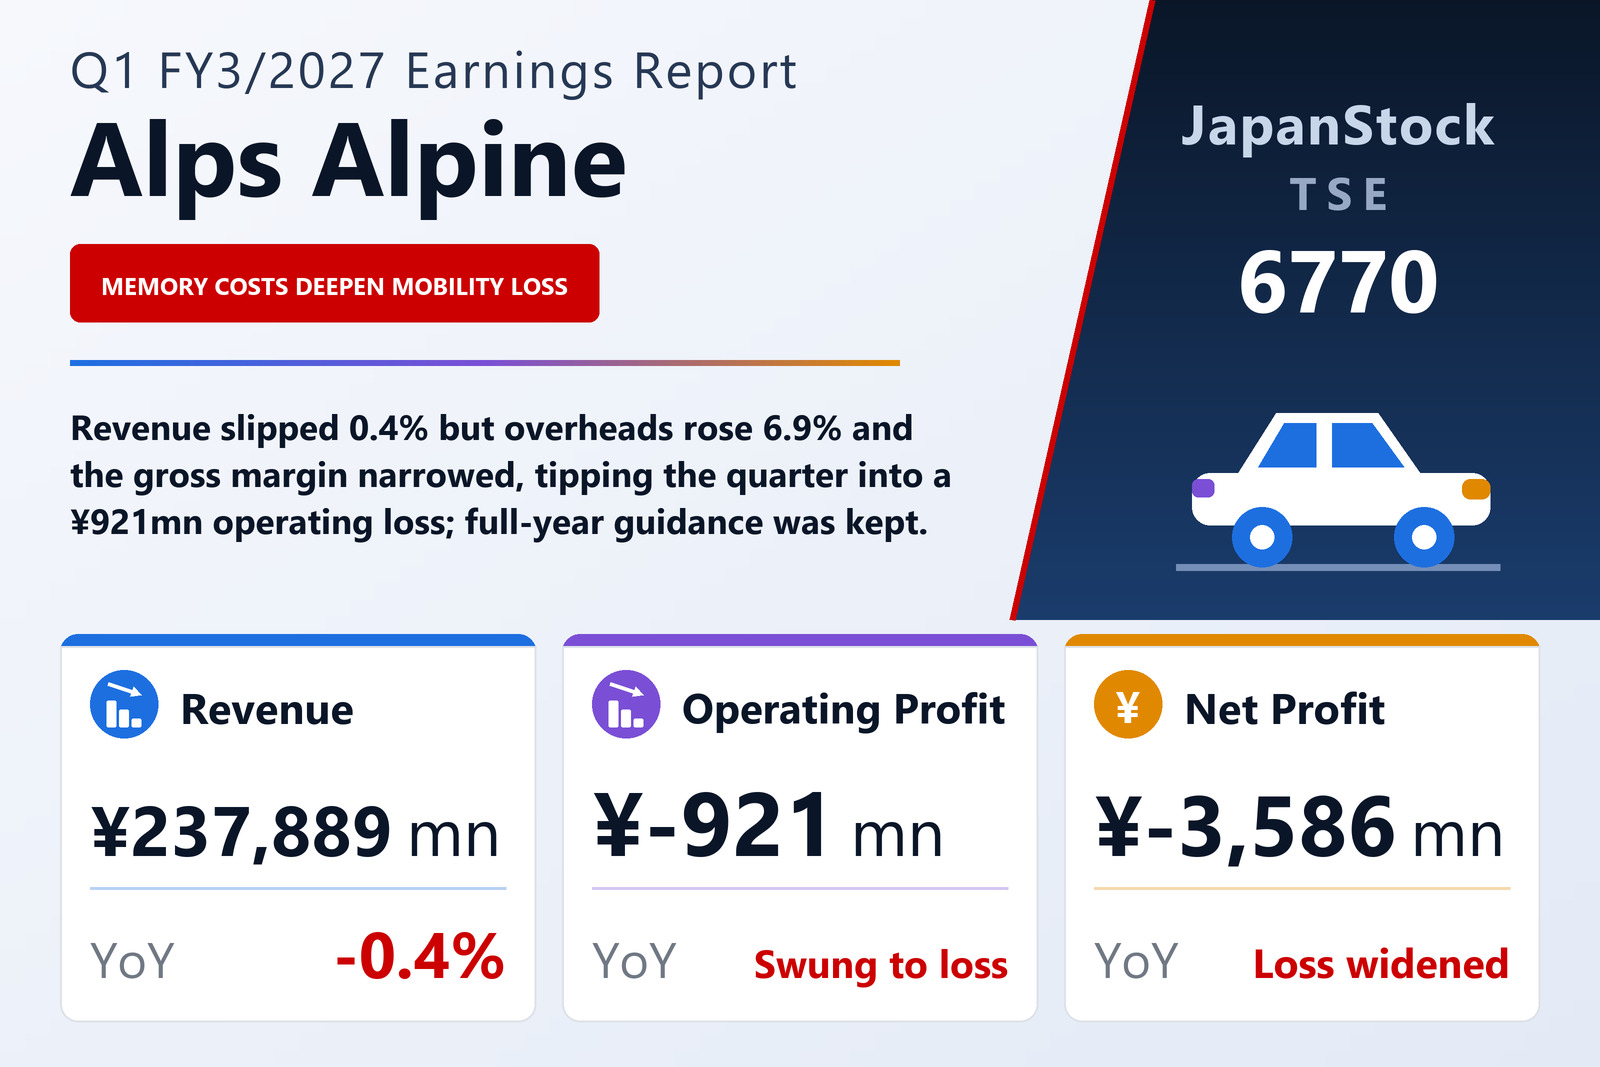
Alps Alpine Co., Ltd. (TSE: 6770), the electronic-components and automotive-systems group, published consolidated results for the first quarter of FY3/2027 — April 1 to June 30, 2026 — on July 31, 2026 under Japanese GAAP. Revenue slipped 0.4% to ¥237,889 million, and the company swung to an operating loss of ¥921 million from an operating profit of ¥3,726 million a year earlier. Ordinary profit fell 91.3% to ¥110 million, and the net loss attributable to owners of the parent widened to ¥3,586 million from ¥2,821 million. The loss per share grew faster than the loss itself — to ¥18.38 from ¥13.76, about 34% larger against about 27% for the loss — because the average number of shares outstanding fell to 195,114,490 from 205,136,431.
The arithmetic is short. Cost of sales edged up 0.6% to ¥200,408 million while revenue went slightly the other way, so gross profit fell 5.5% to ¥37,481 million and the gross margin narrowed from 16.6% to 15.8%. Selling, general and administrative expenses, meanwhile, rose 6.9% to ¥38,403 million — ¥2,474 million more than a year earlier, and now larger than gross profit itself. The ¥921 million gap between the two is the operating loss, and the operating margin moved from 1.6% to −0.4%. The filing does not itemize the increase in selling, general and administrative expenses.
Mobility grew 12.7% and lost more; Components shrank by a quarter
Mobility, the automotive business, is by far the largest segment: external revenue rose 12.7% to ¥148,165 million, about 62% of the group total, on firm sales at its main customers, the Japanese, North American and European automakers. The filing says both its Tier 1 business, which supplies custom products to vehicle makers, and its Tier 2 business, which supplies Tier 1 manufacturers, ran above the prior-year level. Yet the segment loss widened to ¥3,090 million from ¥539 million, which the filing attributes mainly to higher costs from rising memory prices driven by expanding data-center investment.
Components moved the other way. External revenue fell 25.5% to ¥61,808 million: products for the consumer and automotive markets were broadly flat, while products for the mobile market declined. The filing notes that business with a major smartphone maker came in below the prior year but within the company's expectations. Segment profit fell 56.2% to ¥2,729 million, mainly on the lower sales.
Sensor & Communication was the one segment to improve. Revenue rose 16.8% to ¥23,146 million on higher sales of small photo printers for the mobile market and of glass lenses for the consumer market, the latter on demand from data centers, and the segment loss narrowed to ¥499 million from ¥2,143 million, helped by lower development costs as work on a large new product wound down. The Other segment — system development, office services and finance and leasing — posted revenue of ¥4,770 million against ¥4,762 million and a loss of ¥51 million against a profit of ¥189 million. In total, the ¥3,505 million drop in Components profit and the ¥2,551 million deterioration in Mobility far outweighed the ¥1,644 million improvement in Sensor & Communication.
Smaller currency losses kept ordinary profit positive; the tax charge deepened the net loss
Below the operating line, the quarter was helped by a much smaller foreign-exchange loss: ¥197 million against ¥3,719 million a year earlier. Non-operating expenses therefore fell to ¥922 million from ¥4,291 million, while non-operating income rose to ¥1,955 million, including equity-method investment income of ¥738 million, interest income of ¥538 million and dividends of ¥521 million. That left ordinary profit at ¥110 million — down 91.3%, but still positive. Extraordinary losses of ¥363 million, mostly a ¥321 million loss on the sale and disposal of fixed assets, against gains of ¥52 million, produced a pre-tax loss of ¥200 million, compared with a pre-tax profit of ¥1,122 million.
Income taxes were nonetheless ¥3,326 million (¥3,840 million a year earlier), a charge on a pre-tax loss for which the filing gives no explanation. The net loss came to ¥3,527 million, of which ¥59 million of profit was attributable to non-controlling interests, leaving the loss attributable to owners of the parent at ¥3,586 million. Comprehensive income, by contrast, swung to ¥3,496 million from minus ¥5,345 million, because foreign-currency translation adjustments added ¥6,736 million against a deduction of ¥823 million a year earlier.
Inventories built up and short-term borrowing rose
Total assets stood at ¥795,146 million on June 30, up ¥11,994 million from March 31. Merchandise and finished goods rose to ¥81,963 million from ¥66,548 million and raw materials and supplies to ¥59,278 million from ¥53,125 million, while cash and deposits fell to ¥140,079 million from ¥153,614 million and notes and accounts receivable to ¥155,402 million from ¥168,376 million. Machinery, equipment and vehicles, net, increased to ¥63,627 million from ¥53,744 million. On the other side, short-term borrowings rose to ¥44,582 million from ¥37,068 million and notes and accounts payable to ¥106,074 million from ¥93,167 million. Retained earnings fell to ¥197,973 million from ¥207,804 million, net assets to ¥446,648 million, and the equity ratio to 55.9% from 57.1%. No quarterly cash-flow statement was prepared; depreciation was ¥8,428 million against ¥8,352 million.
Guidance kept, dividend forecast at ¥64, and a buyback of up to ¥30,000 million
Full-year guidance is unchanged from the forecast published on April 30, 2026: revenue of ¥1,045,000 million (+2.5%), operating profit of ¥48,500 million (+15.4%), ordinary profit of ¥45,500 million (−7.4%) and net profit attributable to owners of the parent of ¥30,000 million (+11.6%), or ¥150.41 per share. The first-half forecast calls for revenue of ¥508,000 million, operating profit of ¥9,000 million (−57.6%) and net profit of ¥1,000 million (−92.5%). After a first-quarter operating loss of ¥921 million, meeting the half-year figure requires second-quarter operating profit of roughly ¥9,900 million, and the full-year figure leaves ¥39,500 million to be earned in the second half.
The dividend forecast is ¥32 at the half-year and ¥32 at the year-end, ¥64 in total against ¥62. On July 31, 2026 the board also resolved to repurchase up to 20,000,000 shares — 10.3% of shares outstanding excluding treasury stock — for up to ¥30,000 million through market purchases on the Tokyo Stock Exchange between August 3, 2026 and March 31, 2027, and to cancel all shares so acquired on March 31, 2027. The stated aim is to raise per-share value and capital efficiency as part of shareholder returns. Separately, the company adopted the new accounting standard for interim financial statements from this quarter, which it says had no effect on the figures.
| Metric | Q1 FY3/2027 | Q1 FY3/2026 | Change |
|---|---|---|---|
| Revenue (¥ million) | 237,889 | 238,920 | −0.4% |
| Cost of sales (¥ million) | 200,408 | 199,263 | +0.6% |
| Gross profit (¥ million) | 37,481 | 39,656 | −5.5% |
| Gross margin | 15.8% | 16.6% | −0.8 pt |
| SG&A expenses (¥ million) | 38,403 | 35,929 | +6.9% |
| Operating profit (¥ million) | −921 | 3,726 | profit to loss |
| Operating margin | −0.4% | 1.6% | −2.0 pt |
| Ordinary profit (¥ million) | 110 | 1,270 | −91.3% |
| Pre-tax profit (¥ million) | −200 | 1,122 | profit to loss |
| Net profit attrib. to owners of parent (¥ million) | −3,586 | −2,821 | loss widened |
| Comprehensive income (¥ million) | 3,496 | −5,345 | loss to profit |
| EPS (¥) | −18.38 | −13.76 | loss widened |
| Components — revenue (¥ million) | 61,808 | 82,919 | −25.5% |
| Components — segment profit (¥ million) | 2,729 | 6,234 | −56.2% |
| Sensor & Communication — revenue (¥ million) | 23,146 | 19,821 | +16.8% |
| Sensor & Communication — segment profit (¥ million) | −499 | −2,143 | loss narrowed |
| Mobility — revenue (¥ million) | 148,165 | 131,417 | +12.7% |
| Mobility — segment profit (¥ million) | −3,090 | −539 | loss widened |
| Other — revenue (¥ million) | 4,770 | 4,762 | +0.2% |
| Other — segment profit (¥ million) | −51 | 189 | profit to loss |
| Total assets (¥ million) | 795,146 | 783,152 | +1.5% |
| Net assets (¥ million) | 446,648 | 449,401 | −0.6% |
| Equity ratio | 55.9% | 57.1% | −1.2 pt |
| FY3/2027 guidance — revenue (¥ million) | 1,045,000 | — | +2.5% |
| FY3/2027 guidance — operating profit (¥ million) | 48,500 | — | +15.4% |
| FY3/2027 guidance — ordinary profit (¥ million) | 45,500 | — | −7.4% |
| FY3/2027 guidance — net profit (¥ million) | 30,000 | — | +11.6% |
| FY3/2027 guidance — EPS (¥) | 150.41 | — | — |
| Annual dividend per share (¥) | 64.00 | 62.00 | +3.2% |
JapanStockPulse provides informational content only and does not constitute investment advice. Figures are taken from the company's published earnings short report and may be subject to subsequent revision.