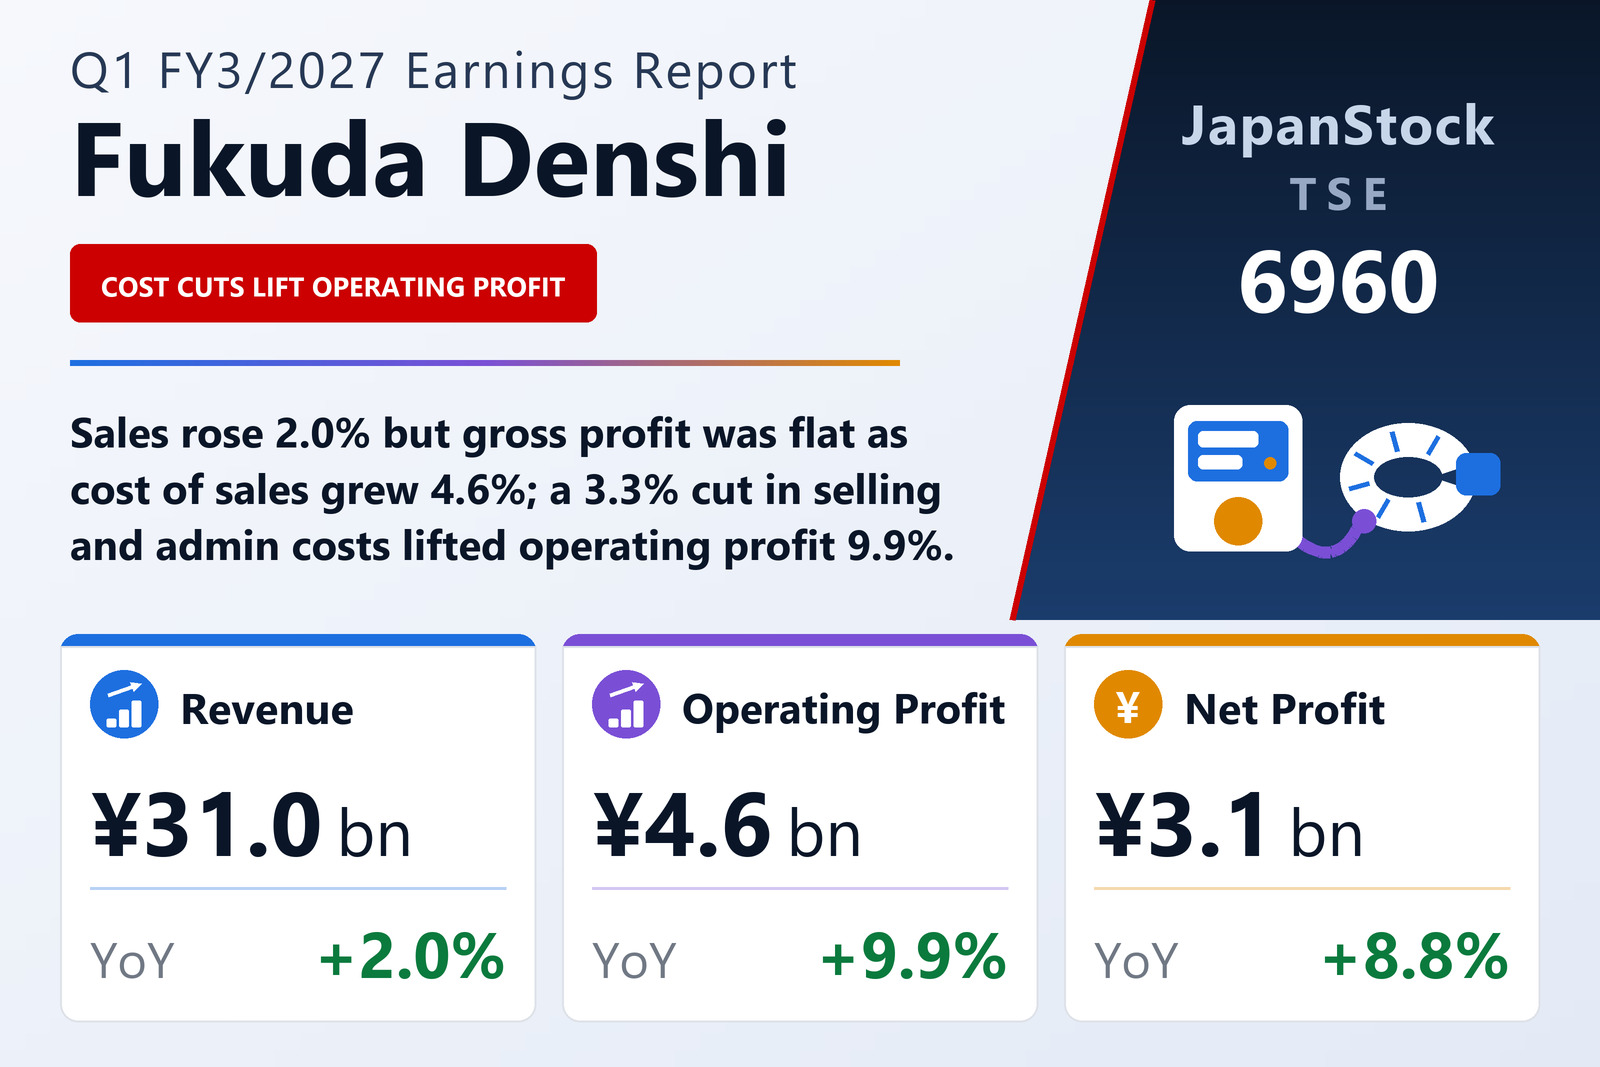
Sales up 2.0%, operating profit up 9.9%
Fukuda Denshi Co., Ltd. (TSE: 6960), a maker of medical electronic equipment spanning physiological diagnostic devices, patient monitors, therapeutic equipment and related consumables, published consolidated results for the first quarter of FY3/2027, the three months from April 1 to June 30, 2026, on July 31, 2026 under Japanese GAAP. Net sales rose 2.0% to ¥30,985 million, operating profit 9.9% to ¥4,592 million, ordinary profit 11.5% to ¥4,867 million and quarterly profit attributable to owners of the parent 8.8% to ¥3,079 million. Earnings per share came to ¥113.97 against ¥100.87, up 13.0% and faster than net profit, because the average number of shares outstanding fell to 27,017,073 from 28,046,966. The filing lists the shares on the Tokyo Stock Exchange.
The company describes the Japanese economy as recovering moderately but clouded by U.S. trade policy and geopolitical risk centred on Europe and the Middle East, and says the medical sector is being asked to advance healthcare digital transformation and to build a more efficient care system through regional healthcare plans. It offers no explanation for the movements in its margins.
Gross profit flat; lower SG&A did the work
Cost of sales rose 4.6% to ¥14,171 million, more than twice the pace of sales, so gross profit slipped by ¥9 million to ¥16,814 million and the gross margin narrowed to 54.3% from 55.4%. The improvement came entirely below that line: selling, general and administrative expenses fell 3.3%, or ¥422 million, to ¥12,221 million, a decline the filing does not explain. The operating margin widened to 14.8% from 13.8%. Depreciation, including amortisation of intangible assets, rose to ¥3,095 million from ¥2,779 million.
Non-operating income rose to ¥294 million from ¥206 million, mostly dividends and interest received, while non-operating expenses were ¥20 million against ¥22 million, so ordinary profit grew 11.5%. Extraordinary gains of ¥80 million, including a ¥78 million gain on the sale of investment securities, took pre-tax profit to ¥4,945 million from ¥4,369 million. Income taxes rose to ¥1,866 million from ¥1,540 million, an effective rate of about 37.7% against 35.2%, as the deferred-tax line swung to a ¥139 million charge from a ¥36 million credit; that is why net profit grew more slowly than ordinary profit. Comprehensive income rose 115.7% to ¥6,920 million, driven by a ¥3,829 million gain on the valuation of available-for-sale securities against ¥485 million a year earlier.
Every segment raised its profit; monitors slipped on sales
Segment profit reconciles to operating profit without adjustment, and there are no intersegment sales. Therapeutic Equipment, the largest segment, grew sales 1.7% to ¥15,612 million on growth in its rental business for home medical care, and segment profit 8.3% to ¥2,545 million. Consumables & Others — consumables used with the group's equipment, plus repair and maintenance — rose 3.0% to ¥9,546 million, with profit up 10.3% to ¥1,265 million. Physiological Diagnostic Equipment sales rose 1.5% to ¥4,526 million even though, according to the filing, sales of electrocardiograph-related products and automated blood-cell counters decreased; its profit rose 16.5% to ¥587 million. Patient Monitors was the only segment with lower sales, down 0.7% to ¥1,301 million, yet its profit rose 10.2% to ¥194 million.
The business is almost entirely domestic. Sales in Japan rose 2.2% to ¥30,529 million, while overseas sales fell to ¥456 million from ¥499 million, about 1.5% of the total. Therapeutic Equipment reported no overseas sales.
An 83.7% equity ratio
Total assets rose 1.7% to ¥229,264 million from ¥225,373 million at March 31, 2026. Notes and accounts receivable fell by ¥7,653 million to ¥26,733 million, while investment securities rose by ¥5,067 million to ¥27,065 million and merchandise and finished goods by ¥2,211 million to ¥10,552 million. Cash and deposits stood at ¥67,469 million against ¥65,724 million. Liabilities rose ¥841 million to ¥37,418 million, chiefly from a ¥1,866 million rise in deferred tax liabilities, while income taxes payable and the bonus provision both fell. Net assets rose ¥3,049 million to ¥191,845 million: retained earnings fell ¥797 million, but the valuation difference on available-for-sale securities rose ¥3,829 million. The equity ratio was 83.7% against 83.8%, and net assets per share ¥7,100.72. No quarterly cash-flow statement was prepared.
Guidance held; sales peak in the fourth quarter
The company says the quarter ran broadly in line with plan and left unchanged the FY3/2027 forecast it published on May 15, 2026: net sales of ¥142,000 million (+1.6%), operating profit of ¥25,500 million (−4.2%), ordinary profit of ¥25,500 million (−6.7%) and profit attributable to owners of the parent of ¥17,700 million (−5.8%), or ¥655.13 per share. It does not publish first-half guidance because its sales tend to peak in the fourth quarter. The first quarter delivered 21.8% of the full-year sales target, 18.0% of operating profit and 17.4% of net profit.
The dividend forecast is ¥115.00 at the interim and ¥115.00 at the year-end, for ¥230.00, the same annual total as FY3/2026 and unchanged from the most recent forecast. The mix shifts, however: each forecast payment comprises an ordinary dividend of ¥80.00 and a special dividend of ¥35.00, giving ¥160.00 ordinary and ¥70.00 special for the year, against ¥145.00 ordinary and ¥85.00 special in FY3/2026 (¥65.00 plus ¥25.00 at the interim, ¥80.00 plus ¥60.00 at the year-end).
| Metric | Q1 FY3/2027 | Q1 FY3/2026 | Change |
|---|---|---|---|
| Net sales (¥ million) | 30,985 | 30,376 | +2.0% |
| Gross profit (¥ million) | 16,814 | 16,823 | −0.1% |
| Gross margin | 54.3% | 55.4% | −1.1 pt |
| SG&A expenses (¥ million) | 12,221 | 12,643 | −3.3% |
| Operating profit (¥ million) | 4,592 | 4,179 | +9.9% |
| Operating margin | 14.8% | 13.8% | +1.0 pt |
| Ordinary profit (¥ million) | 4,867 | 4,363 | +11.5% |
| Net profit attrib. to owners of parent (¥ million) | 3,079 | 2,829 | +8.8% |
| Comprehensive income (¥ million) | 6,920 | 3,208 | +115.7% |
| EPS (¥) | 113.97 | 100.87 | +13.0% |
| Physiological Diagnostic Equipment — revenue (¥ million) | 4,526 | 4,457 | +1.5% |
| Physiological Diagnostic Equipment — segment profit (¥ million) | 587 | 504 | +16.5% |
| Patient Monitors — revenue (¥ million) | 1,301 | 1,310 | −0.7% |
| Patient Monitors — segment profit (¥ million) | 194 | 176 | +10.2% |
| Therapeutic Equipment — revenue (¥ million) | 15,612 | 15,344 | +1.7% |
| Therapeutic Equipment — segment profit (¥ million) | 2,545 | 2,351 | +8.3% |
| Consumables & Others — revenue (¥ million) | 9,546 | 9,264 | +3.0% |
| Consumables & Others — segment profit (¥ million) | 1,265 | 1,147 | +10.3% |
| Total assets (¥ million) | 229,264 | 225,373 | +1.7% |
| Net assets (¥ million) | 191,845 | 188,796 | +1.6% |
| Equity ratio | 83.7% | 83.8% | −0.1 pt |
| FY3/2027 guidance — revenue (¥ million) | 142,000 | — | +1.6% |
| FY3/2027 guidance — operating profit (¥ million) | 25,500 | — | −4.2% |
| FY3/2027 guidance — ordinary profit (¥ million) | 25,500 | — | −6.7% |
| FY3/2027 guidance — net profit (¥ million) | 17,700 | — | −5.8% |
| FY3/2027 guidance — EPS (¥) | 655.13 | — | — |
| Annual dividend per share (¥) | 230.00 | 230.00 | unchanged |
JapanStockPulse provides informational content only and does not constitute investment advice. Figures are taken from the company's published earnings short report and may be subject to subsequent revision.