Currency carried the top line; volumes and costs took the rest
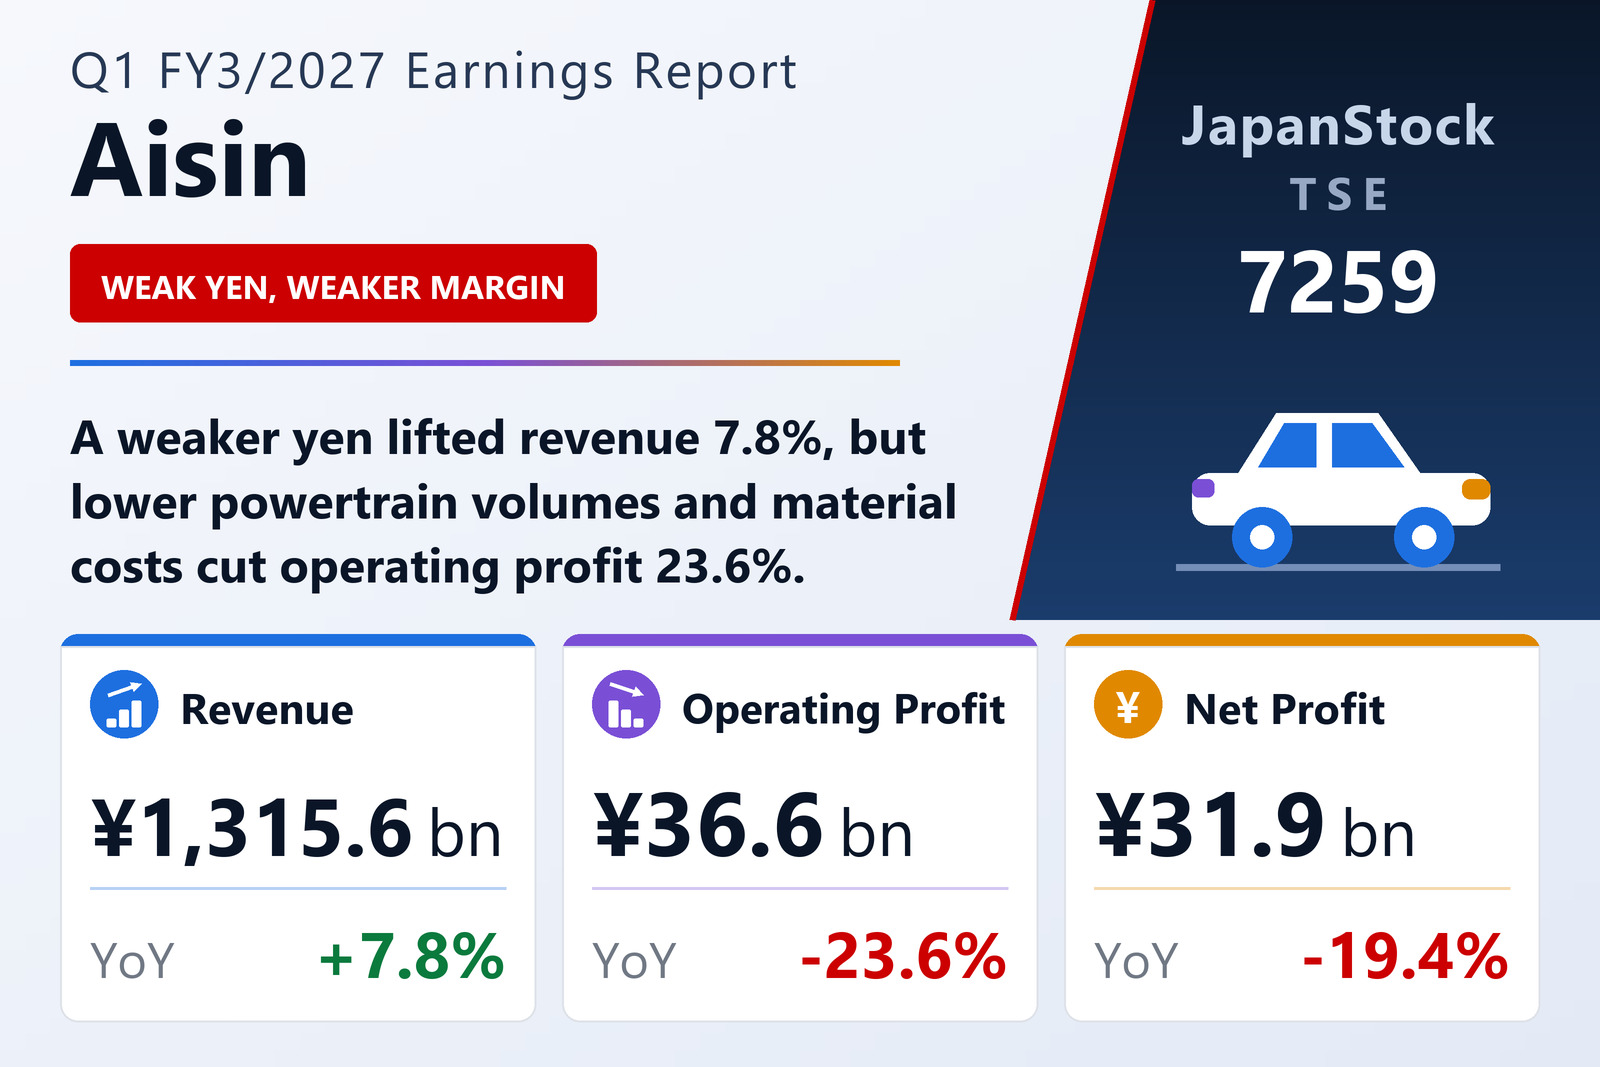
Aisin Corporation (TSE: 7259) published consolidated results for the three months to June 30, 2026 on July 31, 2026 under IFRS. Revenue rose 7.8% to ¥1,315,603 million. The company attributes the increase to the weaker yen rather than to demand: both customer vehicle production and powertrain unit sales declined in the quarter.
Below the top line the picture reverses. Operating profit fell 23.6% to ¥36,592 million, with management citing lower powertrain unit sales and a surge in material prices tied to the situation in the Middle East, partly offset by an accelerated push on cost structure. Profit before tax fell 16.5% to ¥47,846 million and profit attributable to owners of the parent fell 19.4% to ¥31,883 million, for earnings per share of ¥44.48 against ¥52.31.
Comprehensive income fell furthest, down 60.1% to ¥8,666 million, as valuation losses on securities ate into a smaller quarterly profit.
Europe swung to a loss; ASEAN and India grew fastest
Japan lifted revenue 5.8% to ¥807.4 billion and, unusually for this quarter, grew operating profit 30.7% to ¥8.0 billion, as the weak yen and cost-structure work beat material inflation and investment in people. North America grew revenue 19.5% to ¥341.3 billion on higher hybrid-transmission output, but operating profit fell 28.8% to ¥4.8 billion under tariffs and material costs.
Europe was the weak point: revenue fell 17.1% to ¥66.2 billion on lower customer production and the region swung to an operating loss of ¥0.6 billion from a ¥4.0 billion profit, a ¥4.7 billion deterioration, on lower volume and higher production-preparation costs. China fell 6.6% to ¥134.3 billion with operating profit down 48.7% to ¥5.1 billion, while ASEAN and India grew revenue 26.5% to ¥168.4 billion on higher Indian powertrain volumes, with operating profit up 1.6% to ¥16.2 billion.
Balance sheet and unchanged guidance
Total assets fell 2.8% to ¥4,386,968 million from the March 31, 2026 year-end, mainly on lower trade receivables and non-current financial assets. Equity fell 3.1% to ¥2,419,930 million: the quarter's profit was outweighed by lower securities valuation reserves, treasury-share purchases and dividends. The ratio of equity attributable to owners of the parent eased to 48.5% from 48.8%.
Aisin left the full-year FY3/2027 guidance it published on April 28, 2026 unchanged: revenue of ¥5,250,000 million (+2.6%), operating profit of ¥235,000 million (+2.7%), profit before tax of ¥245,000 million (−1.2%) and profit attributable to owners of ¥150,000 million (−12.6%), for earnings per share of ¥212.70. That per-share figure already reflects the share buyback, tender offer and cancellation of treasury shares resolved by the board on April 28, 2026. The annual dividend forecast is ¥75.00, up from ¥70.00 for the year just ended. One quarter in, ¥36,592 million of the ¥235,000 million operating-profit target is banked — 15.6% — so the guidance implies a materially stronger balance of the year.
| Metric | Q1 FY3/2027 | Q1 FY3/2026 | Change |
|---|---|---|---|
| Revenue (¥ million) | 1,315,603 | 1,220,384 | +7.8% |
| Operating profit (¥ million) | 36,592 | 47,876 | -23.6% |
| Pre-tax profit (¥ million) | 47,846 | 57,316 | -16.5% |
| Net profit (¥ million) | 38,056 | 44,691 | -14.8% |
| Net profit attrib. to owners of parent (¥ million) | 31,883 | 39,557 | -19.4% |
| Comprehensive income (¥ million) | 8,666 | 21,699 | -60.1% |
| EPS (¥) | 44.48 | 52.31 | -15.0% |
| Total assets (¥ million) | 4,386,968 | 4,512,274 | -2.8% |
| Shareholders' equity (¥ million) | 2,419,930 | 2,496,098 | -3.1% |
| Equity attrib. to owners of parent (¥ million) | 2,126,175 | 2,200,573 | -3.4% |
| Equity ratio | 48.5% | 48.8% | -0.3 pt |
| FY3/2027 guidance — revenue (¥ million) | 5,250,000 | — | +2.6% |
| FY3/2027 guidance — operating profit (¥ million) | 235,000 | — | +2.7% |
| FY3/2027 guidance — pre-tax profit (¥ million) | 245,000 | — | -1.2% |
| FY3/2027 guidance — net profit (¥ million) | 150,000 | — | -12.6% |
| FY3/2027 guidance — EPS (¥) | 212.70 | — | — |
| Annual dividend per share (¥) | 75.00 | 70.00 | +7.1% |
JapanStockPulse provides informational content only and does not constitute investment advice. Figures are taken from the company's published earnings short report and may be subject to subsequent revision.