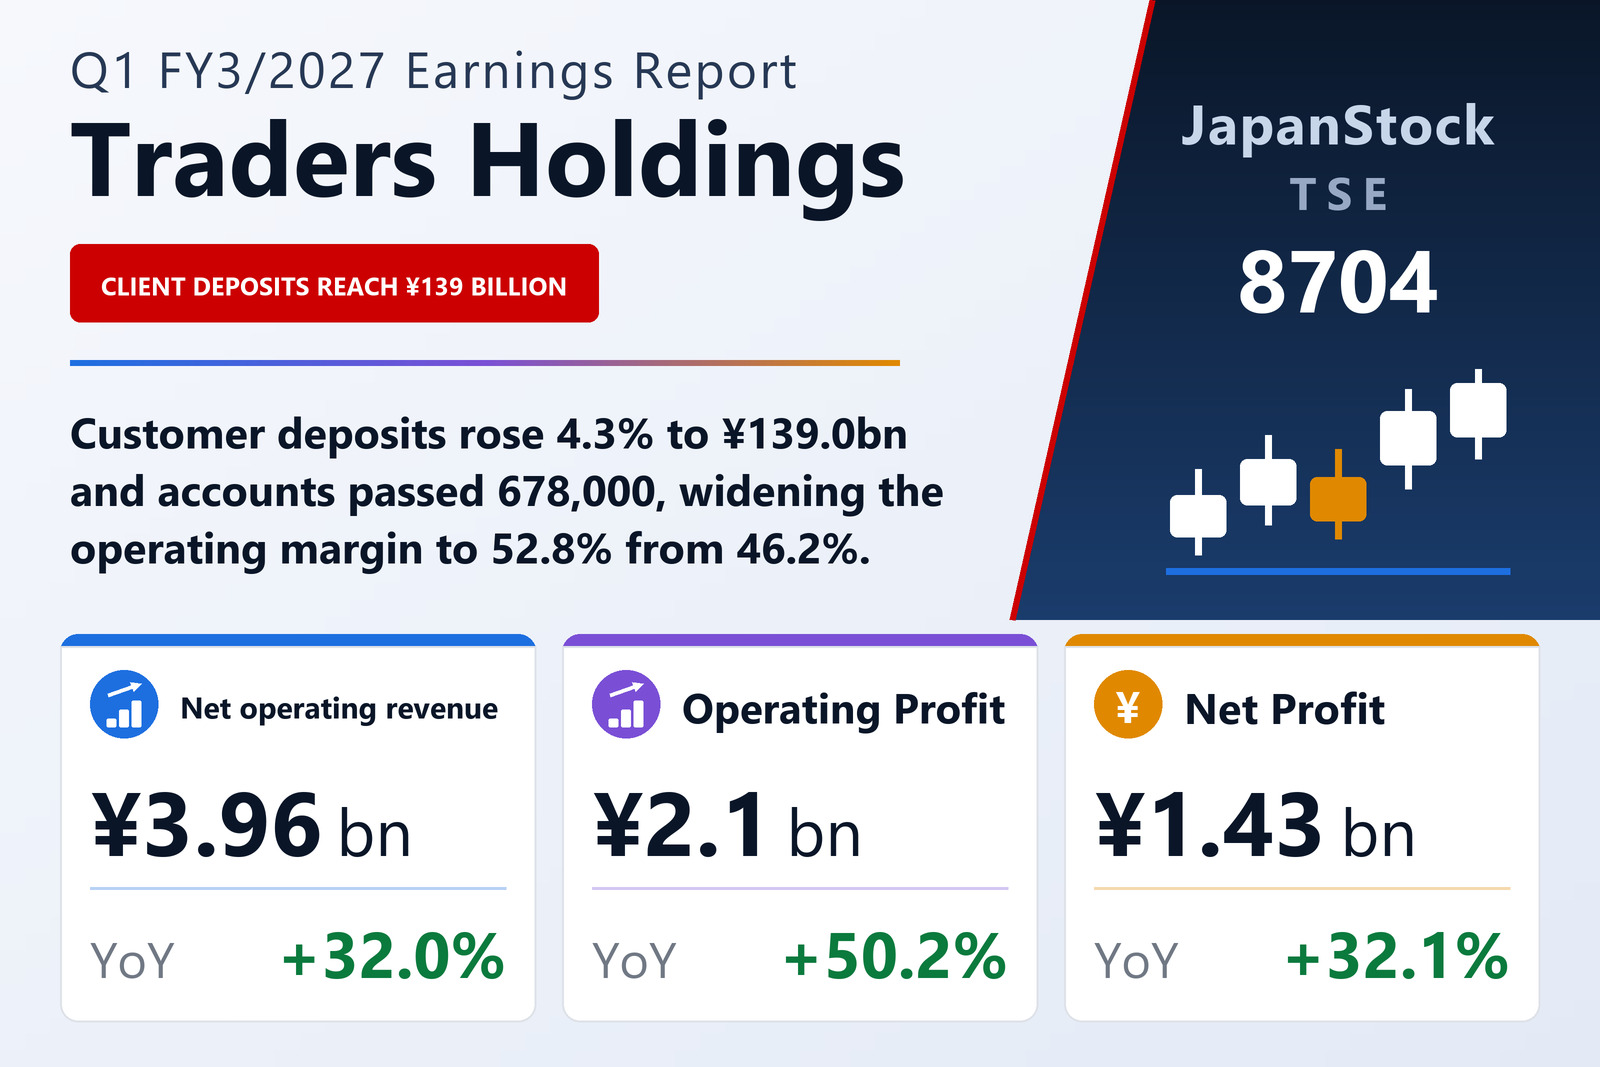
Traders Holdings Co., Ltd. (TSE: 8704), the Tokyo-based holding company behind online FX broker Traders Securities, reported consolidated results for the first quarter of the fiscal year ending March 2027 — the three months from April 1 to June 30, 2026 — under Japanese GAAP. Operating revenue rose 31.7% to ¥3,974 million, net operating revenue 32.0% to ¥3,956 million, operating profit 50.2% to ¥2,097 million, ordinary profit 47.3% to ¥2,080 million and profit attributable to owners of the parent 32.1% to ¥1,426 million. Comprehensive income reached ¥1,435 million, up 34.4%. Basic earnings per share were ¥54.10 against ¥39.63 a year earlier, with a diluted figure of ¥53.27 against ¥39.14. Every one of those lines is measured against a weak base: in the same quarter of the previous year operating revenue had fallen 14.1% and operating profit 32.1%.
Intervention, not trend, created the quarter's revenue opportunity
The company's account of the currency market describes a quarter defined by two short bursts rather than a sustained move. Escalating tension in the Middle East following the military clash between the United States and Iran, together with a surge in crude prices, kept safe-haven dollar buying and yen selling in place. Between late April and early May the government and the Bank of Japan carried out yen-buying intervention — the first since July 2024 — and the exchange rate fell sharply for a time. Wariness of further intervention then capped the upside, while the persistent US–Japan interest-rate gap and stubbornly high oil prices supported the downside, leaving a directionless range. In June, neither the US–Iran ceasefire nor an additional Bank of Japan rate rise drew much of a reaction, and the quarter closed with the yen on a mild depreciating trend. Setting aside the intervention-driven spikes, the company said dollar/yen volatility stayed generally low. Against that backdrop, Traders said it captured revenue opportunities from the abrupt swings around the intervention and from a phase in which interest-rate markets in some currencies spiked on Middle East geopolitical risk. Trading gains, the group's core revenue line, rose 23.5% to ¥3,648 million from ¥2,953 million, while financial revenue multiplied to ¥287 million from ¥12 million — a smaller line, but the fastest-growing one in the quarter.
Costs rose 16%, operating profit rose 50%
The gap between those two growth rates is the story of the quarter. Selling, general and administrative expenses rose 16.1% to ¥1,859 million, an increase of ¥258 million, against a ¥959 million increase in net operating revenue — so roughly three-quarters of every incremental yen of revenue fell through to operating profit. Within costs, transaction-related expenses were almost flat at ¥518 million (up 1.6%); personnel expenses rose 9.1% to ¥667 million as the company pushed its human-capital agenda; real-estate-related expenses rose 32.7% to ¥248 million on heavier system investment; and taxes and dues rose 140.4% to ¥175 million, the sharpest proportional increase in the cost base. The result was an operating margin on operating revenue of 52.8%, up from 46.2%. Below the operating line the direction reverses slightly: net non-operating items turned into a ¥17 million charge, against an ¥18 million net gain a year earlier, so ordinary profit grew 47.3% rather than 50.2%. The larger step down is tax. The total income-tax charge nearly doubled, rising 96.3% to ¥654 million, taking the effective rate to 31.4% from 23.6% — which is why profit attributable to owners of the parent grew 32.1% while operating profit grew 50.2%.
Accounts and client money both grew through the quarter
The financial instruments business, operated by Traders Securities, produced segment revenue of ¥3,952 million, up 32.4%, and segment profit of ¥2,119 million, up 74.1% — profit growth more than twice the revenue growth. Customer accounts stood at 678,947 at the quarter-end, an increase of 16,488 since the March year-end, and customer deposits at ¥139,022 million, up ¥5,727 million or 4.3%. The company attributes the deposit growth to the gradual weakening of the yen, to the accumulation of customers' realised profits, and to the competitive pull of what it describes as industry-leading spreads and swap points. Product work during the quarter was concentrated on the options and analytics side: in May the trading screen of Minna no Option was substantially redesigned, currency pairs were added and round times and target rates revised; in June the AI Analysis Report function was expanded using proprietary, patent-pending AI technology, which the company frames as part of an intellectual-property strategy aimed at products that are difficult to imitate. The group's other reporting segment, system development and consulting run by FleGrowth, posted revenue of ¥856 million, up 15.7%, of which ¥832 million was internal sales to Traders Securities (up 18.0%) and only ¥24 million external (down 29.4%); segment profit rose 59.9% to ¥227 million. An "other" category covering the investment business recorded a ¥7 million loss, and consolidation adjustments subtracted ¥242 million.
Why an 11.4% equity ratio is not a warning sign here
Total assets grew ¥14,472 million to ¥180,229 million. Almost all of that came from client-related items: deposits paid — chiefly customer money held in segregating trusts — rose ¥12,744 million, trading products rose ¥1,707 million and short-term guarantee money deposited rose ¥1,342 million, while cash and deposits fell ¥1,139 million. Total liabilities rose ¥13,648 million to ¥159,526 million, driven by a ¥13,486 million increase in customer margin deposits received, to about ¥154,962 million, partly offset by a ¥312 million fall in income taxes payable. Net assets rose ¥824 million to ¥20,702 million, the ¥1,426 million quarterly profit less ¥632 million of dividends paid. Shareholders' equity was ¥20,540 million against ¥19,722 million, and the equity ratio slipped to 11.4% from 11.9%. That headline ratio says far less about balance-sheet strength than it would at an industrial company: an FX broker holds customer margin money on both sides of the balance sheet — as segregated assets and as a matching liability — so the denominator is dominated by client funds the firm does not own. On these numbers, roughly ¥155 billion of the ¥180.2 billion asset base is customer margin received. The ratio fell this quarter precisely because client money grew faster (up around 9% at the asset level) than retained earnings did.
Q1 ran ahead of the plan's run-rate, and the plan was left unchanged
Traders reiterated the full-year forecast it published on April 30, with no revision: operating revenue of ¥15,700 million (up 18.8%), operating profit of ¥7,000 million (up 13.6%), ordinary profit of ¥7,000 million (up 13.6%), profit attributable to owners of the parent of ¥4,800 million (up 13.1%) and earnings per share of ¥179.95. The plain arithmetic is that the first quarter already delivered 30.0% of the full-year operating-profit plan, 29.7% of the net-profit plan and 25.3% of the revenue plan, and that operating profit grew 50.2% year on year against a full-year plan calling for 13.6% growth. In other words the quarter ran well ahead of the pace the guidance implies, and the guidance was left where it was. The dividend forecast is likewise unchanged from the previous announcement: an interim of ¥22.00 and a year-end of ¥23.00 for an annual ¥45.00, against the ¥40.00 paid for the year to March 2026, which was split ¥16.00 interim and ¥24.00 year-end. The ¥24.00 year-end payment for the prior year, ¥632 million in total, was approved at the annual general meeting on June 24 and became effective on June 25, inside this quarter.
Two July board resolutions will add shares in August
The company disclosed two material subsequent events, both resolved at a board meeting on July 17, 2026 and both taking effect on August 7. The first is a disposal of 179,800 treasury shares as restricted-stock compensation at ¥1,294 per share, a total of ¥232,661,200, allocated to six people: three full-time directors, one outside director, one director who is an audit-committee member, and one outside director of a subsidiary. The second is an issue of stock-option share acquisition rights — 1,776 units carrying 177,600 shares — to 42 employees of the company and directors and employees of its subsidiaries, with an exercise price of ¥1,294 and an exercise window running from July 18, 2028 to July 17, 2036. Together the two schemes cover 357,400 shares, a little over 1% of the 29,538,647 shares issued. Treasury holdings stood at 3,158,444 shares at the quarter-end against 3,175,224 at the year-end, and the weighted-average share count for the quarter was 26,369,131, down from 27,249,597. There were no changes to the scope of consolidation, to accounting policies or to estimates during the period, no quarterly consolidated cash-flow statement was prepared, and depreciation for the quarter was ¥117 million against ¥98 million. The quarterly consolidated financial statements were subject to a voluntary interim review by HLB Meisei LLC.
| Metric | Q1 FY3/2027 | Q1 FY3/2026 | YoY |
|---|---|---|---|
| Operating revenue (¥ million) | 3,974 | 3,018 | +31.7% |
| Net operating revenue (¥ million) | 3,956 | 2,996 | +32.0% |
| Trading gains (¥ million) | 3,648 | 2,953 | +23.5% |
| SG&A expenses (¥ million) | 1,859 | 1,600 | +16.1% |
| Operating profit (¥ million) | 2,097 | 1,395 | +50.2% |
| Operating margin (%) | 52.8 | 46.2 | +6.6 pt |
| Ordinary profit (¥ million) | 2,080 | 1,413 | +47.3% |
| Profit attributable to owners of parent (¥ million) | 1,426 | 1,079 | +32.1% |
| Comprehensive income (¥ million) | 1,435 | 1,067 | +34.4% |
| Basic EPS (¥) | 54.10 | 39.63 | +36.5% |
| Diluted EPS (¥) | 53.27 | 39.14 | +36.1% |
| Customer deposits (¥ million, vs FY3/26 year-end) | 139,022 | 133,295 | +4.3% |
| Customer accounts (vs FY3/26 year-end) | 678,947 | 662,459 | +16,488 |
| Total assets (¥ million, vs FY3/26 year-end) | 180,229 | 165,756 | +8.7% |
| Net assets (¥ million, vs FY3/26 year-end) | 20,702 | 19,878 | +4.1% |
| Shareholders' equity (¥ million, vs FY3/26 year-end) | 20,540 | 19,722 | +4.1% |
| Equity ratio (%, vs FY3/26 year-end) | 11.4 | 11.9 | −0.5 pt |
| FY3/27 operating revenue guidance (¥ million) | 15,700 | — | +18.8% |
| FY3/27 operating profit guidance (¥ million) | 7,000 | — | +13.6% |
| FY3/27 ordinary profit guidance (¥ million) | 7,000 | — | +13.6% |
| FY3/27 profit attributable to owners guidance (¥ million) | 4,800 | — | +13.1% |
| FY3/27 EPS guidance (¥) | 179.95 | — | — |
| Annual dividend (¥, FY3/27 forecast vs FY3/26 actual) | 45.00 | 40.00 | +¥5.00 |
JapanStockPulse provides informational content only and does not constitute investment advice. Figures are taken from the company's published earnings short report and may be subject to subsequent revision.