A record first quarter at the operating line
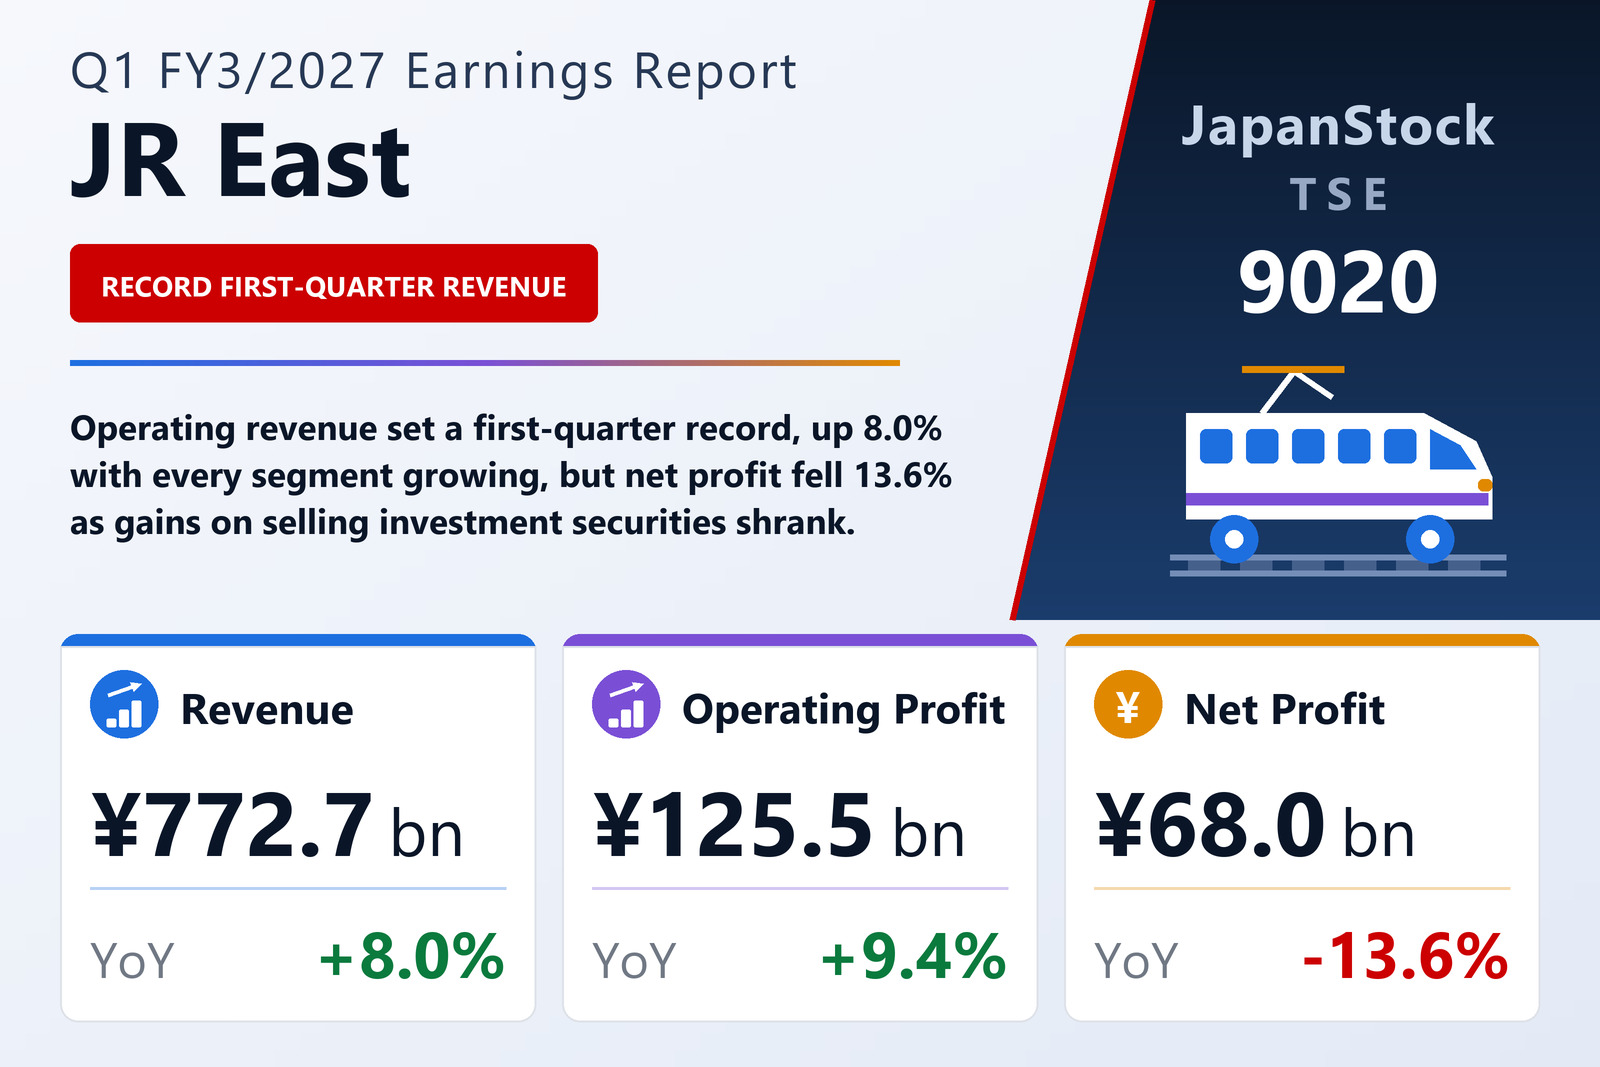
East Japan Railway Company (TSE: 9020), the railway operator at the head of the JR East group, published consolidated results for the first quarter of FY3/2027, the three months from April 1 to June 30, 2026, on July 31, 2026 under Japanese GAAP. Operating revenue rose 8.0% to ¥772,721 million, operating profit 9.4% to ¥125,544 million and ordinary profit 8.0% to ¥106,898 million, but profit attributable to owners of the parent fell 13.6% to ¥68,017 million, for earnings of ¥60.24 per share against ¥69.56.
The company said revenue grew in every segment, helped by higher transportation revenue and real-estate leasing revenue, and that operating revenue has now risen for six consecutive periods and set a record for a first quarter. Operating expenses rose 7.8% to ¥647,177 million — transportation expenses and cost of sales by 7.0% to ¥459,924 million, and selling, general and administrative expenses by 9.8% to ¥187,252 million — so the operating margin edged up to 16.2% from 16.0%. Depreciation, disclosed in a note, rose 6.8% to ¥108,611 million.
Below the operating line: higher interest, smaller securities gains
Ordinary profit grew more slowly than operating profit because interest expense rose 15.9% to ¥22,789 million from ¥19,655 million, while non-operating income slipped to ¥6,530 million from ¥7,100 million. The larger swing came further down. Gains on sales of investment securities fell to ¥6,473 million from ¥22,171 million, cutting extraordinary income to ¥14,024 million from ¥23,356 million, and extraordinary losses roughly doubled to ¥19,586 million from ¥9,568 million, chiefly because losses on retirement of fixed assets rose to ¥9,374 million from ¥205 million.
Profit before income taxes therefore fell 10.1% to ¥101,336 million. The company attributes the decline in net profit to the smaller gains on investment securities; it gives no reason for the higher fixed-asset retirement losses. Comprehensive income fell 28.9% to ¥58,011 million, as an ¥8,700 million decline in valuation differences on available-for-sale securities replaced a ¥4,103 million gain a year earlier.
Transportation carried the profit gain; real estate profit fell by a third
The segment figures here are sales to external customers, which add up to consolidated operating revenue. Transportation, by far the largest segment, grew revenue 8.5% to ¥526,408 million and segment profit 23.7% to ¥83,821 million — an increase of ¥16,049 million, larger than the group's entire ¥10,757 million rise in operating profit. Retail & Services revenue rose 4.7% to ¥98,947 million and profit 7.6% to ¥15,306 million.
Real Estate & Hotels was the exception on profit: revenue rose 5.4% to ¥116,471 million, but segment profit fell 32.9% to ¥19,074 million from ¥28,412 million. The filing does not explain the decline. The Other segment, which covers the IT and Suica businesses such as credit cards, and information processing, grew revenue 23.7% to ¥30,894 million and profit 89.4% to ¥6,591 million.
From this quarter the company moved six overseas subsidiaries, including JRE Business Development UK Ltd. and Decorum Vending Ltd., from Retail & Services to Other as part of a reorganisation of its overseas businesses; the prior-year segment figures have been restated on the new basis.
Balance sheet
Total assets fell 2.6% from the March year-end to ¥10,536,066 million, as cash and deposits fell to ¥121,161 million from ¥262,247 million and other accounts payable to ¥382,660 million from ¥724,238 million. Net assets rose 0.5% to ¥3,074,785 million, lifting the equity ratio to 29.1% from 28.2%. Bonds rose to ¥3,329,614 million from ¥3,289,601 million and long-term loans to ¥1,395,605 million from ¥1,295,607 million. The net defined benefit liability fell to ¥79,995 million from ¥478,797 million while other non-current liabilities rose to ¥636,325 million from ¥324,387 million; the filing does not explain the shift. No quarterly cash-flow statement was prepared.
Guidance and dividend unchanged
JR East left its FY3/2027 forecast unchanged: operating revenue of ¥3,295,000 million (+6.8%), operating profit of ¥429,000 million (+3.6%), ordinary profit of ¥353,000 million (+0.4%) and profit attributable to owners of the parent of ¥255,000 million (+2.9%), for earnings per share of ¥225.85. The first quarter delivered 23.5% of the revenue target and 29.3% of the operating-profit target.
The dividend forecast is also unchanged at ¥84.00 per share for the year — ¥42.00 at the interim and ¥42.00 at year-end — against ¥74.00 paid for FY3/2026, an increase of 13.5%.
| Metric | Q1 FY3/2027 | Q1 FY3/2026 | Change |
|---|---|---|---|
| Operating revenue (¥ million) | 772,721 | 715,349 | +8.0% |
| Operating profit (¥ million) | 125,544 | 114,787 | +9.4% |
| Operating margin | 16.2% | 16.0% | +0.2 pt |
| Ordinary profit (¥ million) | 106,898 | 98,993 | +8.0% |
| Net profit attrib. to owners of parent (¥ million) | 68,017 | 78,692 | −13.6% |
| Comprehensive income (¥ million) | 58,011 | 81,643 | −28.9% |
| EPS (¥) | 60.24 | 69.56 | −13.4% |
| Transportation — revenue (¥ million) | 526,408 | 485,299 | +8.5% |
| Transportation — segment profit (¥ million) | 83,821 | 67,772 | +23.7% |
| Retail & Services — revenue (¥ million) | 98,947 | 94,538 | +4.7% |
| Retail & Services — segment profit (¥ million) | 15,306 | 14,220 | +7.6% |
| Real Estate & Hotels — revenue (¥ million) | 116,471 | 110,539 | +5.4% |
| Real Estate & Hotels — segment profit (¥ million) | 19,074 | 28,412 | −32.9% |
| Other — revenue (¥ million) | 30,894 | 24,972 | +23.7% |
| Other — segment profit (¥ million) | 6,591 | 3,480 | +89.4% |
| Total assets (¥ million) | 10,536,066 | 10,820,726 | −2.6% |
| Net assets (¥ million) | 3,074,785 | 3,060,091 | +0.5% |
| Equity ratio | 29.1% | 28.2% | +0.9 pt |
| FY3/2027 guidance — operating revenue (¥ million) | 3,295,000 | — | +6.8% |
| FY3/2027 guidance — operating profit (¥ million) | 429,000 | — | +3.6% |
| FY3/2027 guidance — ordinary profit (¥ million) | 353,000 | — | +0.4% |
| FY3/2027 guidance — net profit (¥ million) | 255,000 | — | +2.9% |
| FY3/2027 guidance — EPS (¥) | 225.85 | — | — |
| Annual dividend per share (¥) | 84.00 | 74.00 | +13.5% |
JapanStockPulse provides informational content only and does not constitute investment advice. Figures are taken from the company's published earnings short report and may be subject to subsequent revision.