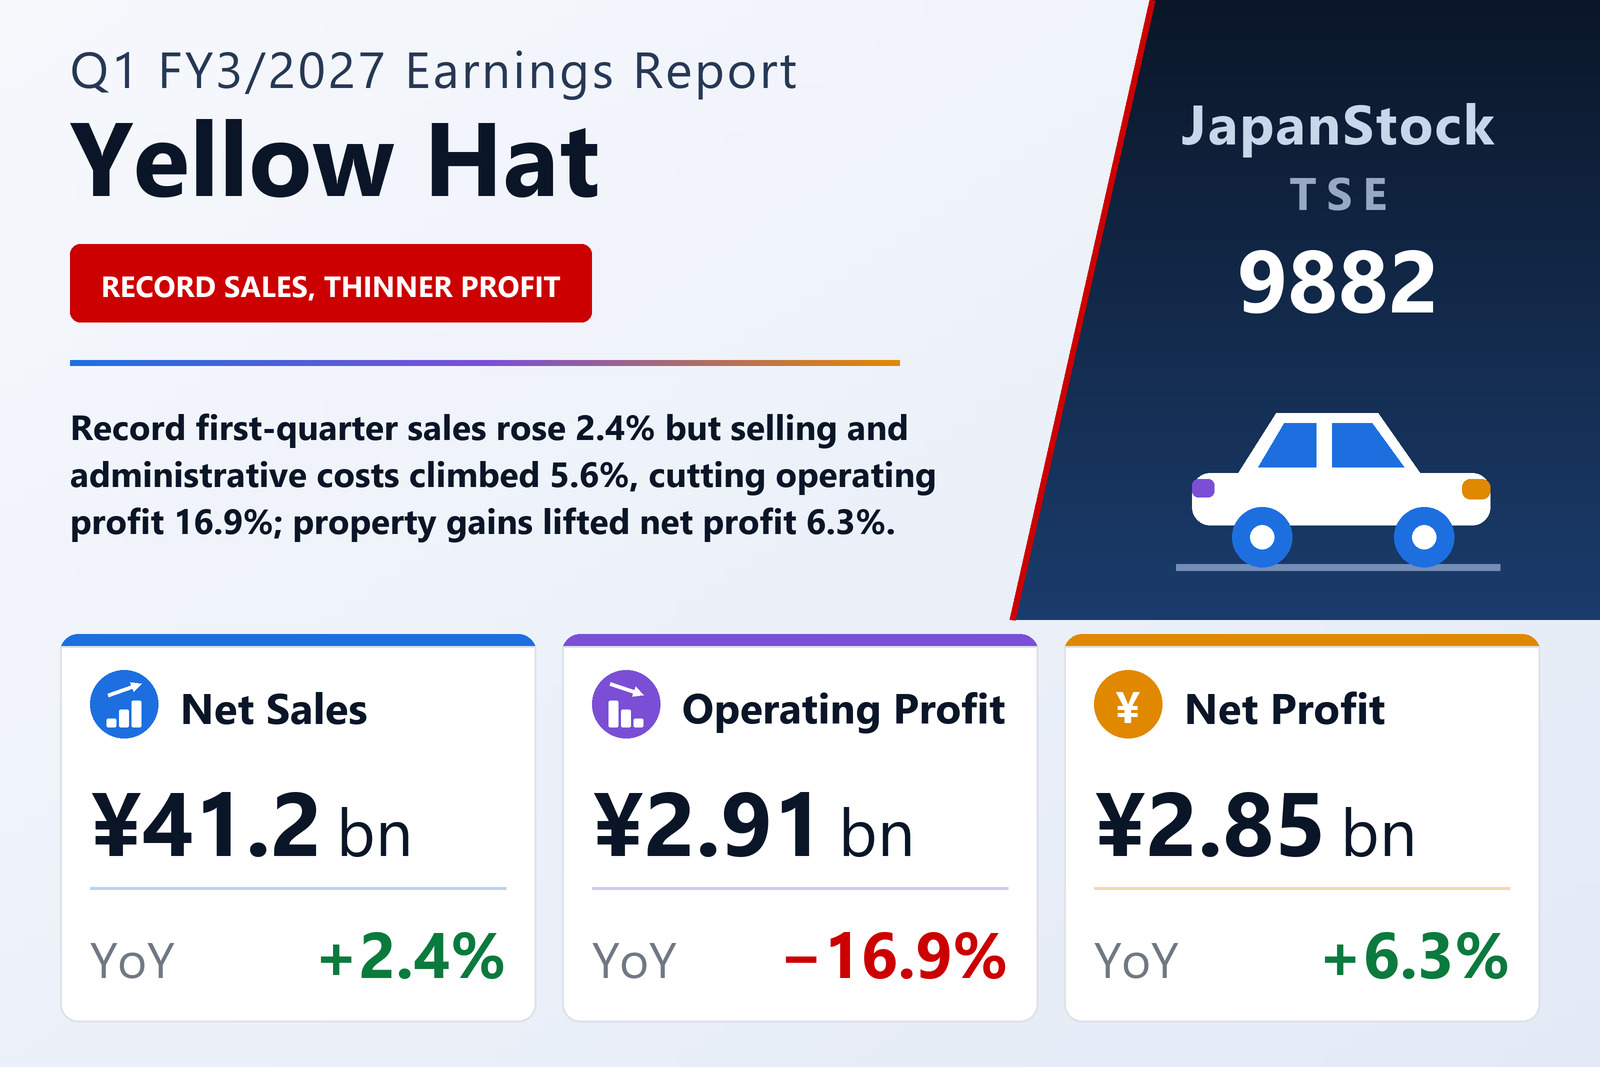
Yellow Hat Ltd. (TSE: 9882), the Tokyo-based operator of the Yellow Hat automotive parts and accessories chain, reported consolidated results for the first quarter of the fiscal year ending March 2027 — the three months from April 1 to June 30, 2026 — under Japanese GAAP. Net sales rose 2.4% to ¥41.25 billion, which the company said was a first-quarter record, as was gross profit of ¥18.53 billion. Below those two lines the direction reverses: operating profit fell 16.9% to ¥2.91 billion and ordinary profit fell 13.0% to ¥3.36 billion, while profit attributable to owners of the parent rose 6.3% to ¥2.85 billion. Basic earnings per share were ¥33.39 against ¥30.34 a year earlier, with a diluted figure of ¥33.27. One caveat applies to every year-on-year comparison here: the company finalised the provisional accounting for a business combination during the previous fiscal year, and the Q1 FY3/2026 comparatives have been restated to reflect that finalisation.
Consumables sold well; store-running costs rose faster
Management attributed the top line to strong sales of consumables — tyres, engine oil and batteries — as concern over raw-material and product supply linked to tensions in the Middle East, and over future price rises, pulled forward customer purchases, alongside higher fitting-labour income. Warmer weather from April supported summer goods, but typhoons and prolonged rain in June held down store visits. Net sales added ¥959 million, yet gross profit added only ¥236 million (+1.3%) to ¥18.53 billion, so the gross margin slipped to 44.9% from 45.4%. Selling, general and administrative expenses rose 5.6%, or ¥827 million, to ¥15.62 billion — more than three times the gross-profit gain — on higher personnel costs from increased store staffing, training spending treated as investment in human capital, DX initiatives aimed at strengthening the customer base, and higher fees tied to an upgrade of the group's sales-data analysis system. The result was a ¥591 million fall in operating profit and an operating margin of 7.0% against 8.7%. By division, retail sales rose 3.6% to ¥28.97 billion while wholesale slipped 0.3% to ¥9.67 billion.
The bottom-line gain came from below the ordinary-profit line
Non-operating income of ¥533 million against ¥416 million and non-operating expenses of ¥80 million against ¥51 million left ordinary profit down ¥503 million, or 13.0%. What turned a falling ordinary profit into a rising net profit was extraordinary income: the group booked ¥1,014 million of extraordinary gains against just ¥51 million a year earlier, comprising ¥876 million of gains on the sale of fixed assets — which management describes as disposals of real estate whose profitability did not meet the cost of capital — and ¥138 million from the liquidation of an affiliated company. Extraordinary losses were ¥214 million against ¥1 million, of which ¥212 million was information-security countermeasure costs. The net extraordinary contribution was therefore ¥800 million versus ¥50 million, a ¥750 million swing that more than covers the ¥503 million decline in ordinary profit. Pre-tax profit rose 6.3% to ¥4,161 million; total income taxes were ¥1,314 million against ¥1,236 million, an effective rate of 31.6% in both periods, so tax was not a factor. In other words, the entire increase in the bottom line is attributable to asset sales, not to the operating business. Total comprehensive income rose 68.3% to ¥4.32 billion, lifted by a ¥1,614 million increase in net unrealised gains on available-for-sale securities against a ¥125 million decline a year earlier.
Both segments saw profit fall; the network reaches 938 stores
The car and motorcycle supplies retailing segment, which accounts for 96.5% of group sales, grew revenue 2.5% to ¥39.80 billion but saw segment profit fall 18.1% to ¥2.56 billion, a ¥567 million decline. The real-estate leasing segment was essentially flat at ¥1.45 billion of revenue, with segment profit down 6.4% to ¥346 million. Segment profit corresponds to consolidated operating profit, and the company reported no material impairment losses and no significant change in goodwill. On the store network, Yellow Hat opened Hachinohe Jokamachi (Aomori) in June and closed the existing Hachinohe store (Aomori) in May. Outside the core banner it opened Bike-Kan Kanazawa Nonoichi and Y's Road Kanazawa Nonoichi (both Ishikawa) in April, a 2Rinkan vehicle-inspection and tyre outlet at Minami-Machida (Tokyo) in May and a self-service car wash at Kitagata (Gifu) in June, while closing Bike-Kan 246 Tsukushino (Tokyo) in April, the Sapporo Satozuka self-service car wash (Hokkaido) in May and the Zama plant of the 2Rinkan Yellow Hat vehicle-inspection centre (Kanagawa) in June. At quarter-end the group operated 765 Yellow Hat stores, 66 2Rinkan outlets, 78 Bike-Kan stores including Kawasaki Plaza and 29 Y's Road stores — 938 in total — plus nine vehicle-inspection centres, 12 self-service car washes and 101 NicoNico Rent-a-Car locations.
Balance sheet steady as a buyback offsets securities gains
Total assets edged down 0.4% to ¥205.97 billion from ¥206.82 billion at the March year-end. Current assets fell ¥1,265 million to ¥90.29 billion, with notes and accounts receivable down ¥2,311 million and other current assets, mainly accounts receivable-other, down ¥1,192 million, against a ¥1,742 million rise in cash and deposits to ¥41.47 billion. Non-current assets rose ¥419 million to ¥115.68 billion as investment securities gained ¥2,357 million, while land fell ¥959 million and buildings and structures, net, fell ¥539 million — the asset-side trace of the property disposals. Total liabilities fell ¥1,199 million to ¥81.72 billion, with notes and accounts payable down ¥1,486 million and income taxes payable down ¥1,417 million. Net assets rose ¥353 million to ¥124.25 billion: a ¥1,616 million increase in valuation difference on available-for-sale securities was largely offset by a ¥1,144 million increase in treasury stock. Under a buyback resolved by the board on May 8, 2026, the company acquired 681,800 of its own shares during the quarter for ¥1,142 million, taking treasury stock to ¥1,800 million and treasury shares to 1,156,040 from 473,112. The equity ratio improved to 60.3% from 59.8% and net assets per share to ¥1,462.40 from ¥1,446.59. No quarterly cash-flow statement was prepared; depreciation was ¥945 million against ¥825 million, and goodwill amortisation ¥22 million against ¥28 million.
Guidance unchanged; annual dividend forecast raised to ¥68.00
Yellow Hat left both the half-year and the full-year forecasts it published on May 8, 2026 unchanged. For the six months to September it guides net sales of ¥80.00 billion (+0.9%), operating profit of ¥5.60 billion (+1.7%), ordinary profit of ¥6.20 billion (+1.2%) and net profit of ¥4.90 billion (+13.4%), for EPS of ¥57.28. For the full year it guides net sales of ¥176.00 billion (+2.8%), operating profit of ¥16.00 billion (+6.0%), ordinary profit of ¥17.40 billion (+4.9%) and net profit of ¥12.20 billion (+1.9%), for EPS of ¥142.61 — a per-share figure that does not incorporate the effect of the buyback. The first quarter delivered 23.4% of forecast full-year sales and 23.3% of forecast net profit, but only 18.2% of forecast operating profit and 19.3% of forecast ordinary profit, so the guided 6.0% rise in operating profit requires a marked improvement over the remaining nine months. The dividend forecast is likewise unrevised: an interim of ¥34.00 and a year-end of ¥34.00 for an annual ¥68.00, up ¥6.00 from the ¥62.00 paid for the year to March 2026, which comprised an interim ¥29.00 and a year-end ¥33.00. The quarterly consolidated financial statements were subject to a voluntary interim review by PwC Japan LLC.
| Metric | Q1 FY3/2027 | Q1 FY3/2026 | YoY |
|---|---|---|---|
| Net sales (¥ million) | 41,248 | 40,288 | +2.4% |
| Gross profit (¥ million) | 18,530 | 18,293 | +1.3% |
| SG&A expenses (¥ million) | 15,623 | 14,795 | +5.6% |
| Operating profit (¥ million) | 2,907 | 3,498 | −16.9% |
| Operating margin (%) | 7.0 | 8.7 | −1.7 pt |
| Ordinary profit (¥ million) | 3,360 | 3,863 | −13.0% |
| Extraordinary income (¥ million) | 1,014 | 51 | +¥963m |
| Extraordinary losses (¥ million) | 214 | 1 | +¥213m |
| Pre-tax profit (¥ million) | 4,161 | 3,914 | +6.3% |
| Profit attributable to owners of parent (¥ million) | 2,846 | 2,677 | +6.3% |
| Basic EPS (¥) | 33.39 | 30.34 | +10.1% |
| Total comprehensive income (¥ million) | 4,321 | 2,568 | +68.3% |
| Segment profit — car & motorcycle supplies (¥ million) | 2,560 | 3,127 | −18.1% |
| Segment profit — real-estate leasing (¥ million) | 346 | 370 | −6.4% |
| Total assets (¥ million, vs FY3/26 year-end) | 205,972 | 206,818 | −0.4% |
| Net assets (¥ million, vs FY3/26 year-end) | 124,251 | 123,897 | +0.3% |
| Equity ratio (%, vs FY3/26 year-end) | 60.3 | 59.8 | +0.5 pt |
| Net assets per share (¥, vs FY3/26 year-end) | 1,462.40 | 1,446.59 | +1.1% |
| FY3/27 net sales guidance (¥ million) | 176,000 | — | +2.8% |
| FY3/27 operating profit guidance (¥ million) | 16,000 | — | +6.0% |
| FY3/27 ordinary profit guidance (¥ million) | 17,400 | — | +4.9% |
| FY3/27 net profit guidance (¥ million) | 12,200 | — | +1.9% |
| FY3/27 EPS guidance (¥) | 142.61 | — | — |
| Annual dividend (¥, FY3/27 forecast vs FY3/26 actual) | 68.00 | 62.00 | +¥6.00 |
JapanStockPulse provides informational content only and does not constitute investment advice. Figures are taken from the company's published earnings short report and may be subject to subsequent revision.