A quarter that reversed the year before it
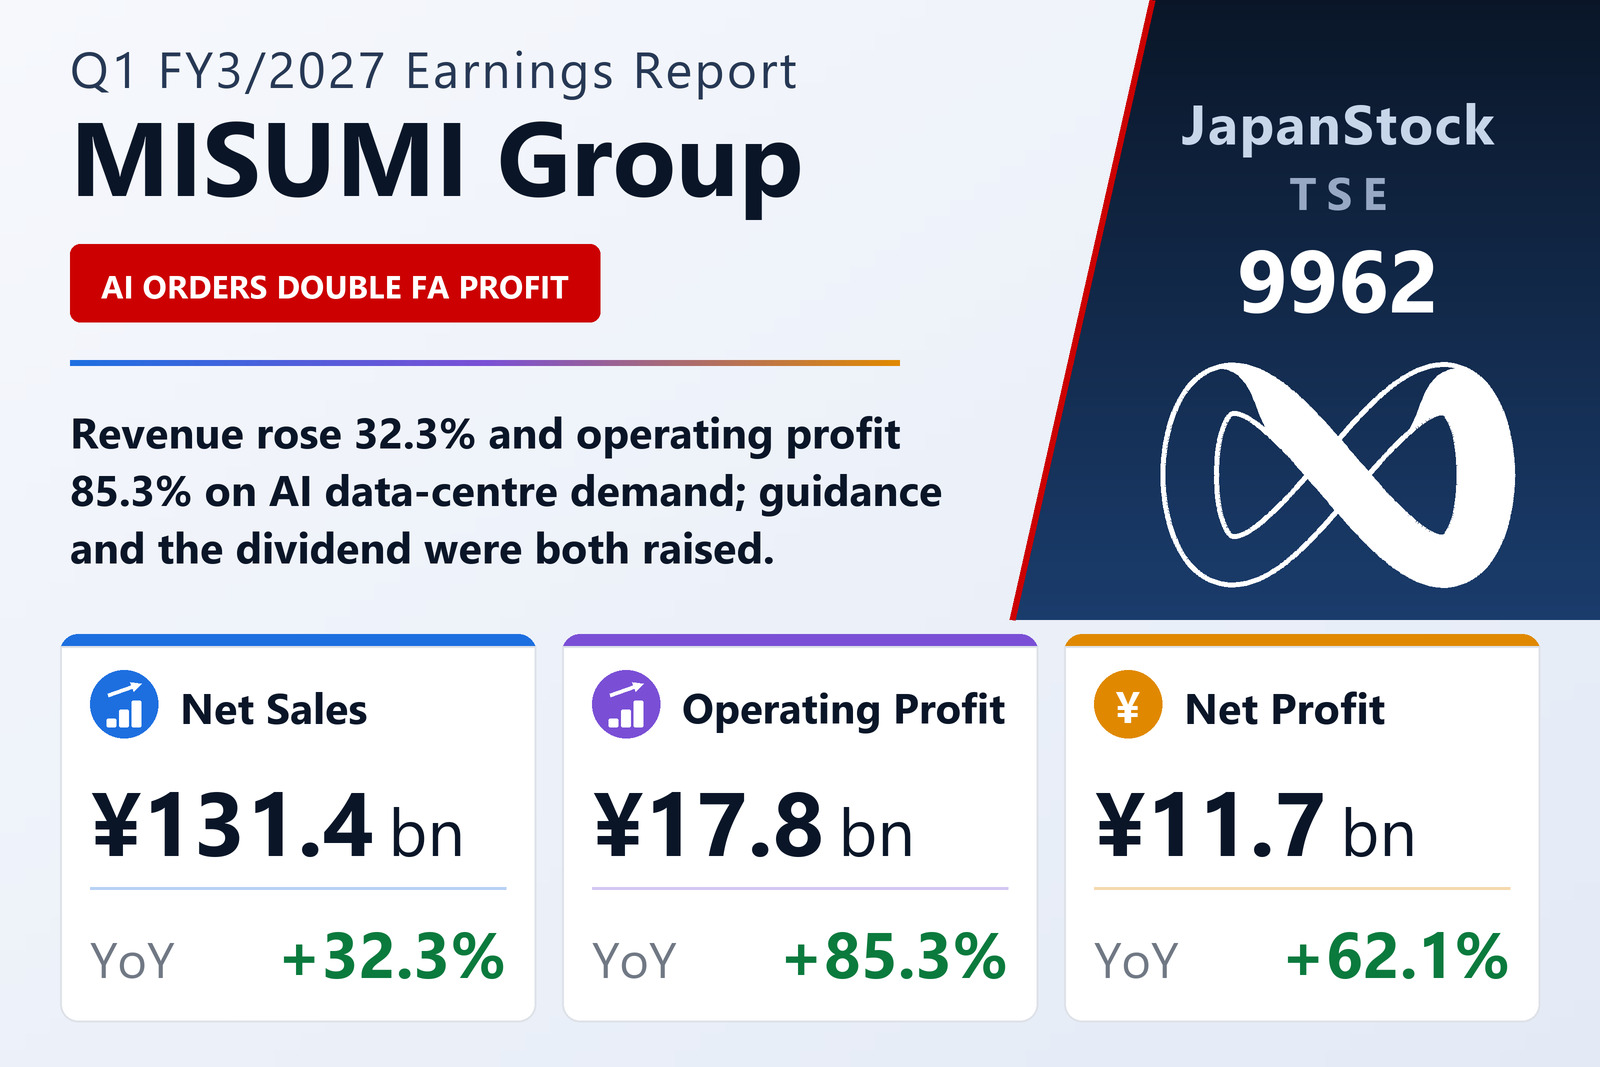
MISUMI Group Inc. (TSE: 9962) published consolidated results for the three months to June 30, 2026 on July 31, 2026 under Japanese GAAP. Revenue rose 32.3% to ¥131,440 million — against a 0.2% decline a year earlier — and operating profit rose 85.3% to ¥17,837 million after an 18.6% fall in the same quarter last year. The operating margin widened to 13.6% from 9.7%.
Ordinary profit rose 73.6% to ¥17,830 million and net profit attributable to owners of the parent 62.1% to ¥11,703 million, for earnings per share of ¥44.23 against ¥26.28. Comprehensive income rose 336.5% to ¥17,863 million.
The company frames the quarter around its own hybrid model — a manufacturer and a distributor in one business — and around demand: AI-related investment expanded data-centre and semiconductor demand, and a partial recovery appeared in automotive, a core customer industry.
FA more than doubled its profit
The FA segment grew revenue 53.6% to ¥51,555 million and operating profit 107.3% to ¥8,130 million — more than doubling — as it captured a recovery in global capital-investment demand and data-centre-related orders, with digital initiatives including Fictiv, the Economy series, D-JIT and meviy leading performance.
VONA, the distribution arm that sells manufacturing and automation parts and MRO indirect materials including other makers' products, grew revenue 24.5% to ¥55,679 million — the largest segment by revenue — and operating profit 88.8% to ¥6,776 million, with every region except Europe growing at double digits and profitability improving on top of the volume. Die Components grew revenue 14.9% to ¥24,205 million and operating profit 38.5% to ¥2,931 million in an environment the company calls broadly firm, with regional variation.
Guidance and dividend both raised
Total assets rose 1.9% to ¥473,910 million from the March 31, 2026 year-end, up ¥8,941 million, as current assets grew ¥10,244 million on higher receivables and raw materials. Total liabilities rose 5.4% to ¥86,952 million and net assets 1.2% to ¥386,957 million, leaving the equity ratio at 81.1% against 81.7% — a balance sheet with almost no leverage.
MISUMI revised its full-year FY3/2027 guidance: revenue of ¥532,000 million (+20.5%), operating profit of ¥67,000 million (+40.7%), ordinary profit of ¥67,300 million (+37.1%) and net profit of ¥44,800 million (+10.7%), for earnings per share of ¥169.67. First-half guidance is revenue of ¥266,000 million (+29.2%), operating profit of ¥35,000 million (+78.4%) and net profit of ¥23,300 million (+66.5%).
The dividend forecast was revised too, to ¥59.45 for the year — ¥30.92 interim and ¥28.53 at year-end — against ¥52.98 paid for FY3/2026 (¥18.02 plus ¥34.96). Note the shape of the profit guidance: operating profit is guided up 40.7% but net profit only 10.7%, so the full-year figure below the operating line grows far more slowly than the line above it.
| Metric | Q1 FY3/2027 | Q1 FY3/2026 | Change |
|---|---|---|---|
| Net sales (¥ million) | 131,440 | 99,368 | +32.3% |
| Operating profit (¥ million) | 17,837 | 9,627 | +85.3% |
| Operating margin | 13.6% | 9.7% | +3.9 pt |
| Ordinary profit (¥ million) | 17,830 | 10,272 | +73.6% |
| Net profit attrib. to owners of parent (¥ million) | 11,703 | 7,219 | +62.1% |
| Comprehensive income (¥ million) | 17,863 | 4,092 | +336.5% |
| EPS (¥) | 44.23 | 26.28 | +68.3% |
| FA — revenue (¥ million) | 51,555 | — | +53.6% |
| FA — segment profit (¥ million) | 8,130 | — | +107.3% |
| Die Components — revenue (¥ million) | 24,205 | — | +14.9% |
| Die Components — segment profit (¥ million) | 2,931 | — | +38.5% |
| VONA — revenue (¥ million) | 55,679 | — | +24.5% |
| VONA — segment profit (¥ million) | 6,776 | — | +88.8% |
| Total assets (¥ million) | 473,910 | 464,969 | +1.9% |
| Net assets (¥ million) | 386,957 | 382,509 | +1.2% |
| Equity ratio | 81.1% | 81.7% | -0.6 pt |
| FY3/2027 guidance — revenue (¥ million) | 532,000 | — | +20.5% |
| FY3/2027 guidance — operating profit (¥ million) | 67,000 | — | +40.7% |
| FY3/2027 guidance — ordinary profit (¥ million) | 67,300 | — | +37.1% |
| FY3/2027 guidance — net profit (¥ million) | 44,800 | — | +10.7% |
| FY3/2027 guidance — EPS (¥) | 169.67 | — | — |
| Annual dividend per share (¥) | 59.45 | 52.98 | +12.2% |
JapanStockPulse provides informational content only and does not constitute investment advice. Figures are taken from the company's published earnings short report and may be subject to subsequent revision.