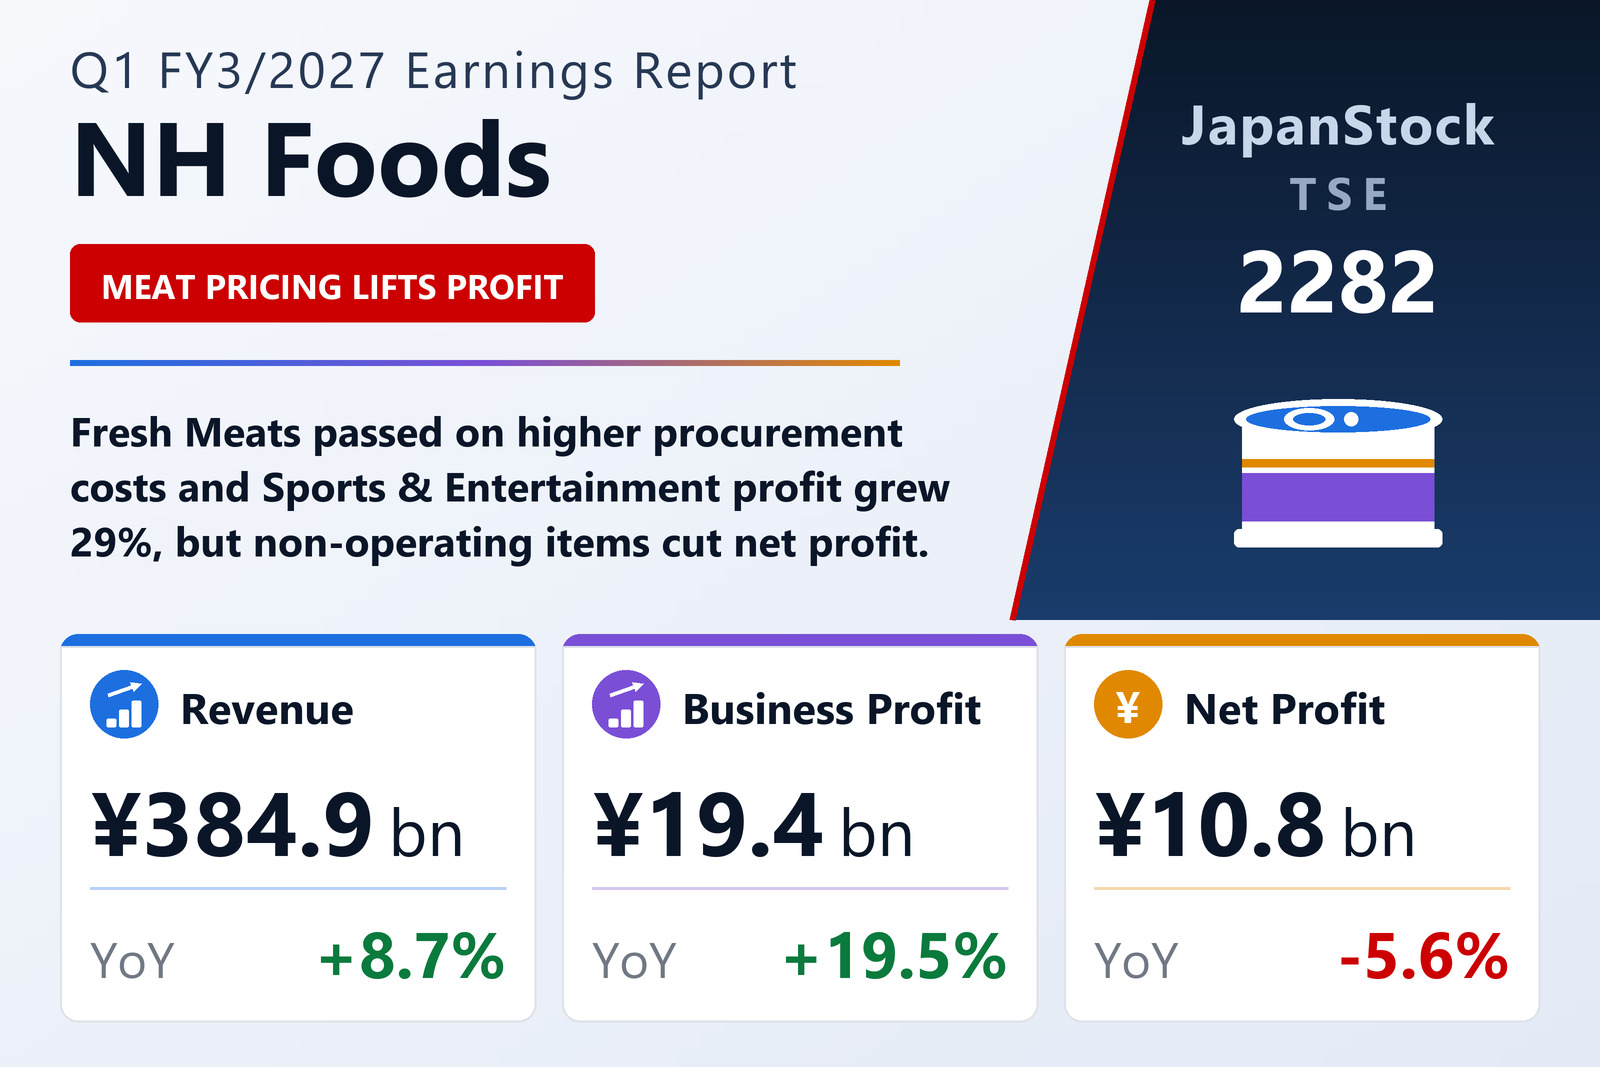
NH Foods Ltd. (TSE: 2282), the parent of the Nippon Ham group, reported consolidated first-quarter results for the three months to June 30, 2026 under IFRS. Revenue rose 8.7% to ¥384,946 million and business profit — the group's own operating measure — climbed 19.5% to ¥19,415 million. Profit before tax edged up only 0.6% to ¥18,523 million, and profit attributable to owners of the parent fell 5.6% to ¥10,772 million, giving basic earnings per share of ¥114.46 against ¥115.40. Comprehensive income nonetheless rose 24.5% to ¥14,647 million.
The divergence between the operating and bottom lines is straightforward arithmetic. Business profit is defined as revenue less cost of sales and SG&A, adjusted for the group's own definition of foreign-exchange gains and losses and excluding IFRS adjustments and non-recurring items — so it does not track pre-tax profit one for one. Beneath pre-tax profit, the income-tax charge grew to roughly ¥6.3 billion from ¥5.9 billion and the share attributable to non-controlling interests widened to about ¥1.4 billion from ¥1.1 billion, which together turned a marginally higher pre-tax figure into a lower attributable one.
Fresh Meats does the work; a new segment appears
NH Foods created a Sports & Entertainment Division in April 2026, folding the former ballpark business beneath it, and now reports it as a separate segment; the allocation of corporate costs also changed, and prior-year segment data has been restated. On that basis the Fresh Meats Division carried the quarter, with revenue up 12.2% to ¥280,805 million and segment profit up 20.4% to ¥15,264 million. Procurement prices rose across livestock types, but the company passed them through, and its Australian beef operation held sales volume even as unit prices climbed; disciplined pricing and inventory management on imported meat, plus a brand strategy in the sales arm, did the rest. The Processed Foods Division grew revenue 2.5% to ¥132,189 million on strong domestic consumer brands and higher output at its North American subsidiary, but segment profit fell 13.9% to ¥746 million as raw-material prices surged on Middle East disruption — the one clear soft spot in the quarter. Sports & Entertainment was the growth star in percentage terms: revenue up 13.2% to ¥12,544 million and profit up 29.2% to ¥4,911 million, on solid attendance at ES CON FIELD HOKKAIDO and strong ticket, advertising, merchandise and food-and-beverage income.
| Segment | Revenue (¥ million) | Revenue YoY | Segment profit (¥ million) | Profit YoY |
|---|---|---|---|---|
| Processed Foods Division | 132,189 | +2.5% | 746 | -13.9% |
| Fresh Meats Division | 280,805 | +12.2% | 15,264 | +20.4% |
| Sports & Entertainment Division | 12,544 | +13.2% | 4,911 | +29.2% |
| Segment total | 425,538 | +11.0% | 20,921 | +20.6% |
| Eliminations & adjustments | -40,592 | — | -1,506 | — |
| Consolidated | 384,946 | +8.7% | 19,415 | +19.5% |
Meat inventory swells the balance sheet — and drains cash
Total assets rose 2.2% to ¥1,019,630 million. Current assets grew 5.5% to ¥462,330 million, dominated by a 13.7% increase in inventories to ¥174,468 million on higher meat unit prices and volumes, plus a jump in other financial assets to ¥16,097 million; cash and equivalents fell 15.1% to ¥58,321 million. Non-current assets slipped 0.3% to ¥557,300 million as property, plant and equipment eased 0.2% to ¥375,187 million, while intangibles and goodwill rose 2.8% to ¥40,150 million on software investment tied to the group's digital push. Liabilities increased 5.3% to ¥469,607 million: income taxes payable dropped 30.7% to ¥10,758 million, but interest-bearing debt rose 10.7% to ¥252,983 million as the company borrowed to cover near-term funding needs. Equity attributable to owners declined 0.6% to ¥533,917 million — the ¥10,772 million quarterly profit was outweighed by ¥15,062 million of cash dividends — pushing the equity attributable ratio down 1.4 points to 52.4%.
Cash generation was the quarter's weakest line. Operating cash flow was a bare ¥1,961 million inflow: pre-tax profit of ¥18,523 million, depreciation and amortisation of ¥11,062 million and an ¥8,215 million rise in payables were nearly all absorbed by a ¥20,640 million build in inventories. Investing used ¥10,594 million, almost entirely ¥10,506 million of fixed-asset purchases. Financing used ¥2,766 million, as a ¥25,885 million increase in short-term borrowings funded ¥15,172 million of dividends and ¥10,001 million of share buybacks. Cash and equivalents ended ¥10,358 million lower at ¥58,321 million.
Guidance untouched — and it implies a much weaker rest of the year
NH Foods left both its half-year and full-year forecasts exactly as published on May 8, 2026. For the first half it guides revenue of ¥745,000 million (+3.1%) with business profit of ¥34,000 million (-6.4%), pre-tax profit of ¥34,000 million (-11.2%) and attributable profit of ¥22,000 million (-5.1%). For the full year: revenue of ¥1,500,000 million (+2.9%), business profit of ¥61,000 million (-10.7%), pre-tax profit of ¥55,000 million (+0.8%) and attributable profit of ¥38,000 million (+8.4%), for EPS of ¥403.68. The arithmetic is worth pausing on: the first quarter already delivered 31.8% of the full-year business-profit target while that target itself calls for a 10.7% annual decline — implying management expects the imported-meat pricing tailwind to fade and raw-material costs to bite harder over the balance of the year. The dividend forecast is also unchanged and materially higher: ¥180.00 per share for FY3/2027 against ¥160.00 for FY3/2026, paid entirely at the year-end.
| Metric | Q1 FY3/2027 | Q1 FY3/2026 | YoY |
|---|---|---|---|
| Revenue (¥ million) | 384,946 | 354,141 | +8.7% |
| Business profit (¥ million) | 19,415 | 16,241 | +19.5% |
| Profit before tax (¥ million) | 18,523 | 18,418 | +0.6% |
| Profit for the quarter (¥ million) | 12,210 | 12,555 | -2.7% |
| Profit attributable to owners (¥ million) | 10,772 | 11,417 | -5.6% |
| Comprehensive income (¥ million) | 14,647 | 11,764 | +24.5% |
| Basic EPS (¥) | 114.46 | 115.40 | -0.8% |
| Operating cash flow (¥ million) | 1,961 | — | — |
| Inventories (¥ million) | 174,468 | — | +13.7% |
| Interest-bearing debt (¥ million) | 252,983 | — | +10.7% |
| Total assets (¥ million) | 1,019,630 | 997,477 | +2.2% |
| Equity attributable to owners (¥ million) | 533,917 | 536,940 | -0.6% |
| Equity attributable ratio (%) | 52.4 | 53.8 | -1.4pt |
| Annual dividend per share (¥) | 180.00 | 160.00 | +12.5% |
| FY3/2027 guidance — business profit (¥ million) | 61,000 | — | -10.7% |
JapanStockPulse provides informational content only and does not constitute investment advice. Figures are taken from the company’s published earnings short report and may be subject to subsequent revision.