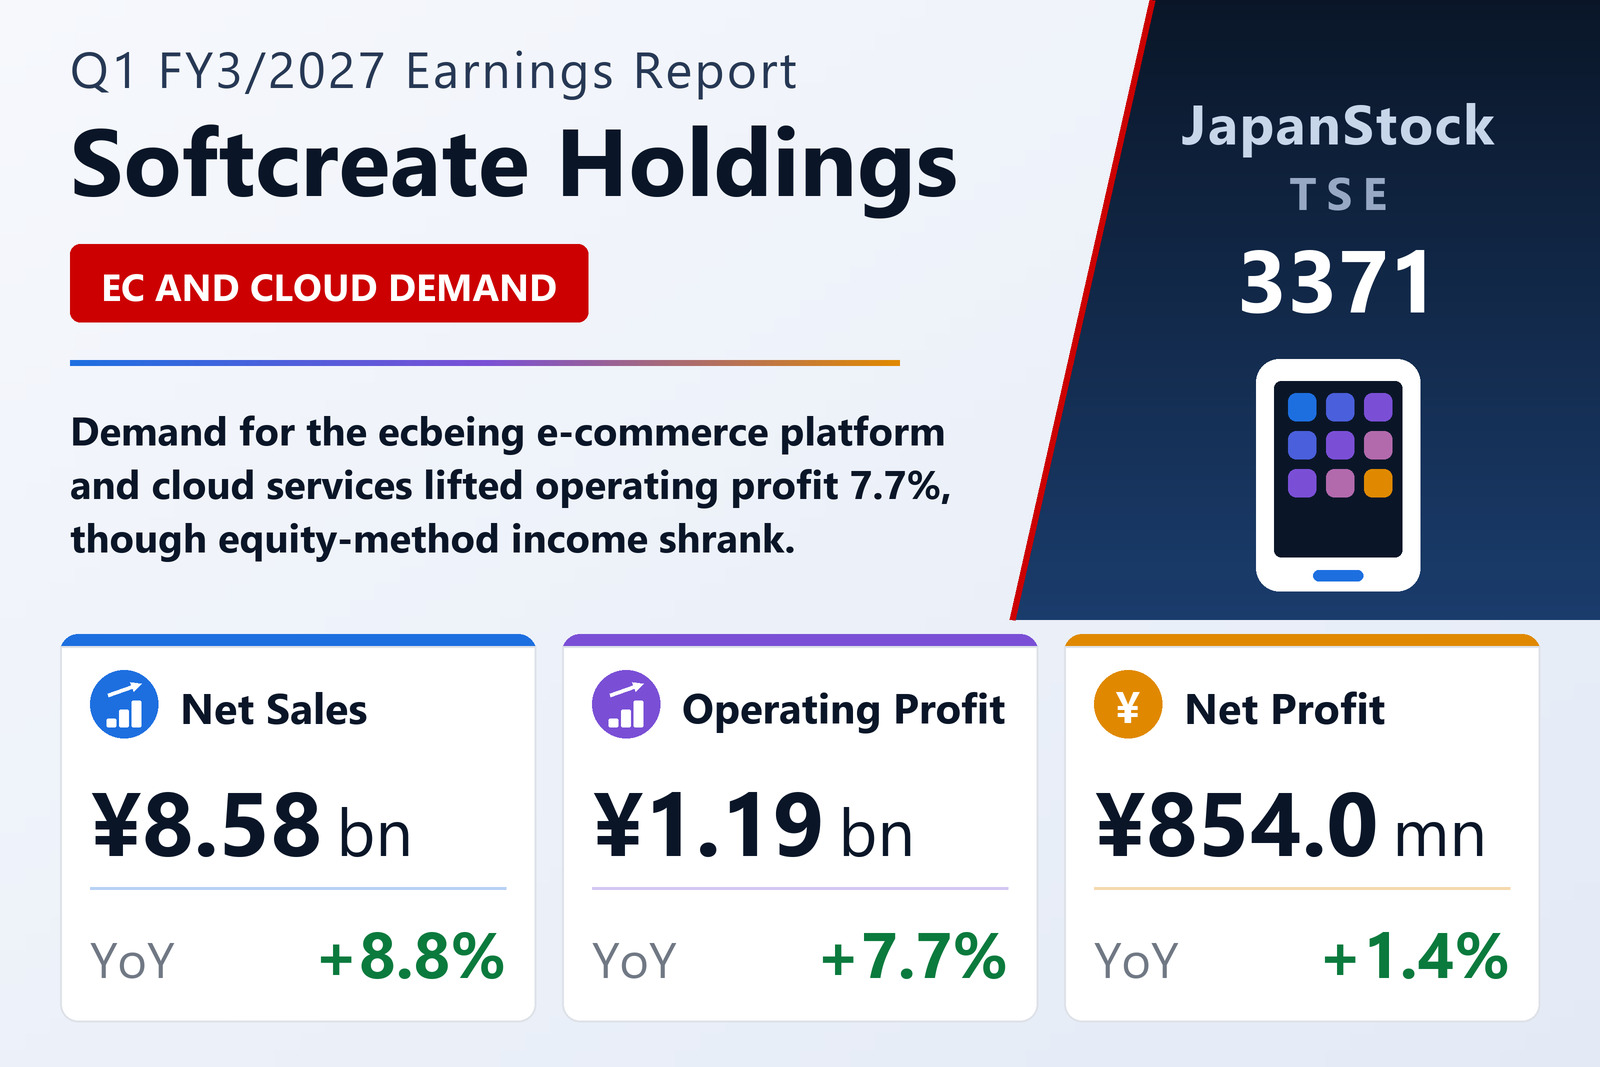
Softcreate Holdings Co., Ltd. (TSE: 3371), the Tokyo-based holding company behind the ecbeing e-commerce platform and a range of enterprise cloud and security services, reported consolidated results for the first quarter of the fiscal year ending March 31, 2027 — the three months from April 1 to June 30, 2026 — under Japanese GAAP. Net sales rose 8.8% to ¥8,583 million, operating profit rose 7.7% to ¥1,194 million, ordinary profit slipped 1.1% to ¥1,316 million, and net profit attributable to owners of the parent rose 1.4% to ¥854 million. Basic earnings per share were ¥33.64, against ¥33.84 a year earlier; diluted EPS was ¥33.64, up from ¥33.41. Comprehensive income jumped 41.1% to ¥1,337 million.
Both segments grew — but the profit mix flipped
Softcreate reports in two segments, and both expanded on the top line. EC Solutions, which sells the ecbeing site-building package alongside SaaS products including the Mercart e-commerce cloud service, the visumo visual-marketing tool, the ReviCo review-optimisation tool and the Sechstant omnichannel analytics suite, lifted external sales 7.9% to ¥4,626 million on stronger site-construction work and growing cloud revenue. But segment profit fell 16.9% to ¥944 million, pointing to a heavier cost base as the company invests behind the SaaS line-up.
IT Solutions — home to the group's own SC Cloud and X-point Cloud workflow services, the AgileWorks and L2Blocker products, and security and infrastructure build work — grew external sales 9.9% to ¥3,956 million and lifted segment profit 25.8% to ¥655 million. The swing was enough to offset the EC decline: combined reportable-segment profit came to ¥1,600 million against ¥1,658 million a year earlier, with unallocated corporate costs and intersegment eliminations trimming ¥284 million (versus ¥327 million last year). Management also flagged demand for Safe AI Gateway, its in-house generative-AI service for corporate customers, as a new driver alongside the established DX, cloud and security themes.
Why ordinary profit fell while operating profit rose
The divergence sits entirely below the operating line. Non-operating income dropped 43.0% to ¥127 million from ¥222 million, and the single largest cause was equity-method investment income, which fell to ¥52 million from ¥172 million — a ¥120 million swing on its own. Sponsorship income (¥41 million) and dividend income (¥24 million) both rose, but not by enough to close the gap. At the same time non-operating expenses climbed to ¥4.6 million from a negligible ¥14 thousand, as the company booked settlement-related and compensation costs. Net, the ¥86 million improvement at the operating line was more than erased, leaving ordinary profit ¥15 million lower year on year.
A securities gain, then a heavier tax bill
Below ordinary profit the picture turns positive again. The quarter carried ¥208 million of extraordinary income — principally a ¥204 million gain on the sale of investment securities, plus ¥5 million from the reversal of share-subscription rights — against no extraordinary losses at all. Pre-tax profit therefore rose 14.6% to ¥1,525 million. That gain, however, was largely handed back to the tax line: total income tax expense rose 39.4% to ¥577 million, lifting the effective rate to 37.9% from 31.1%. Non-controlling interests took a further ¥93 million, up from ¥74 million. What reached parent shareholders was consequently a much flatter +1.4%.
EPS slipped on a larger share count
Basic EPS fell to ¥33.64 from ¥33.84 even though attributable profit grew, because the denominator grew faster. The weighted-average share count rose about 2.0% to 25,405,136 shares from 24,898,758, as treasury stock was drawn down over the past year — the treasury holding stood at 2,077,788 shares at June 30, against 2,211,388 at the March year-end, on an unchanged 27,550,278 shares issued. Diluted EPS moved the other way, rising to ¥33.64 from ¥33.41, as previously dilutive subscription rights ceased to weigh on the calculation.
Balance sheet strengthens as receivables unwind
Total assets ended the quarter at ¥41,460 million, down ¥600 million from the March year-end, as a ¥1,863 million fall in notes, accounts receivable and contract assets outweighed a ¥564 million build in cash and deposits and a ¥513 million rise in investment securities. Liabilities fell further — down ¥1,223 million to ¥11,635 million — on an ¥865 million drop in income taxes payable and a ¥452 million reduction in the bonus provision. Net assets rose ¥623 million to ¥29,824 million, helped by a ¥399 million increase in unrealised gains on other securities. Shareholders' equity of ¥25,775 million lifted the equity ratio to 62.2% from 59.7%. Depreciation for the quarter was ¥378 million and goodwill amortisation ¥97 million, up sharply from ¥11 million a year earlier.
Guidance held despite the fast start
Softcreate left both its half-year and full-year forecasts exactly as published on May 11, saying results are tracking to plan. For the first half it guides net sales of ¥17,840 million (+8.1%), operating profit of ¥2,745 million (+0.2%), ordinary profit of ¥2,965 million (−2.4%), net profit of ¥1,815 million (−2.9%) and EPS of ¥71.63. For the full year it guides net sales of ¥37,000 million (+7.6%), operating profit of ¥6,300 million (+1.5%), ordinary profit of ¥6,550 million (+0.1%), net profit of ¥4,200 million (+0.6%) and EPS of ¥165.75. The gap between a 7.7% first-quarter operating gain and a 1.5% full-year target implies a distinctly more cautious view of the remaining nine months — although at ¥1,194 million the quarter delivered only 19.0% of the annual operating-profit target and 43.5% of the half-year figure, so the phasing is weighted to later quarters. The annual dividend forecast is unchanged at ¥62.00 per share (¥31.00 interim plus ¥31.00 year-end), matching the prior year.
| Metric | Q1 FY3/2027 | Q1 FY3/2026 | YoY |
|---|---|---|---|
| Net sales (¥ million) | 8,583 | 7,887 | +8.8% |
| Operating profit (¥ million) | 1,194 | 1,108 | +7.7% |
| Ordinary profit (¥ million) | 1,316 | 1,330 | -1.1% |
| Net profit attrib. to owners (¥ million) | 854 | 842 | +1.4% |
| Basic EPS (¥) | 33.64 | 33.84 | -0.6% |
| EC Solutions sales (¥ million) | 4,626 | 4,287 | +7.9% |
| EC Solutions segment profit (¥ million) | 944 | 1,136 | -16.9% |
| IT Solutions sales (¥ million) | 3,956 | 3,599 | +9.9% |
| IT Solutions segment profit (¥ million) | 655 | 520 | +25.8% |
| Total assets (¥ million) | 41,460 | 42,060 | -1.4% |
| Equity ratio (%) | 62.2 | 59.7 | +2.5 pt |
| FY3/2027 operating profit guidance (¥ million) | 6,300 | — | +1.5% |
JapanStockPulse provides informational content only and does not constitute investment advice. Figures are taken from the company's published earnings short report and may be subject to subsequent revision.