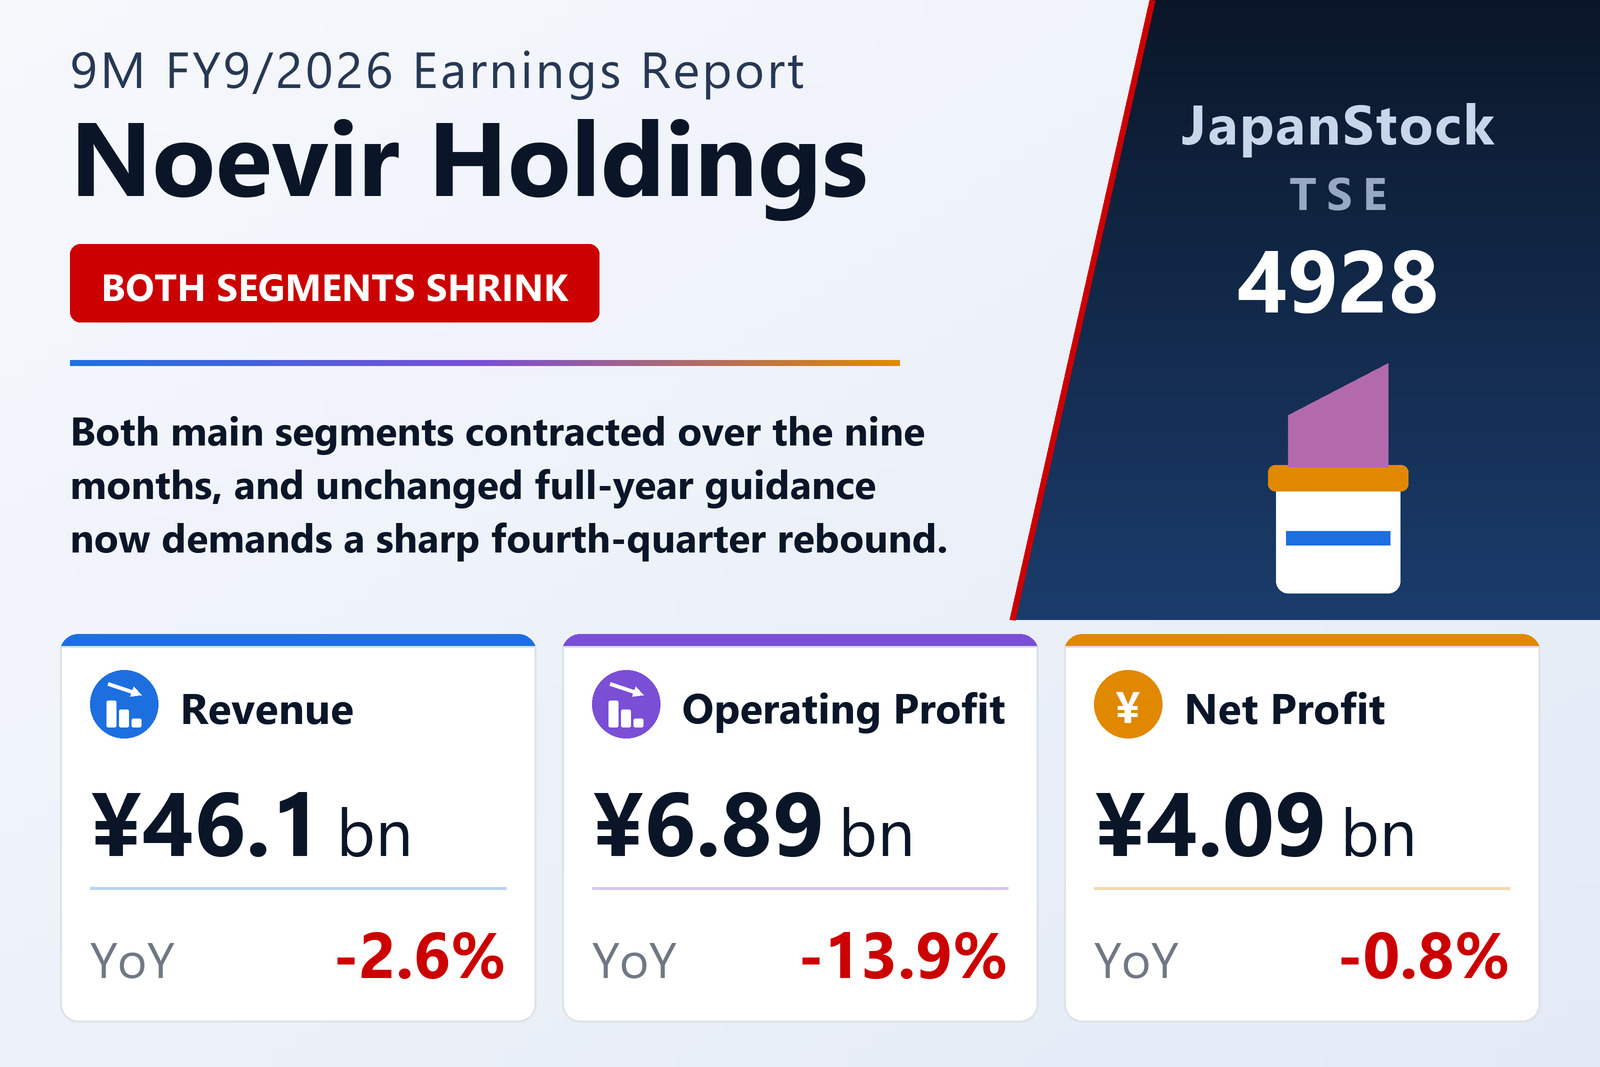
Noevir Holdings Co., Ltd. (TSE: 4928) reported consolidated results for the nine months from October 1, 2025 to June 30, 2026 under Japanese GAAP. Revenue fell 2.6% to ¥46,075 million, operating profit dropped 13.9% to ¥6,895 million and recurring profit fell 13.4% to ¥7,290 million. Profit attributable to owners of the parent was almost unchanged, down 0.8% to ¥4,089 million, for earnings per share of ¥119.72 against ¥120.73. Comprehensive income rose 29.4% to ¥5,394 million on securities marks. The operating margin narrowed to 15.0% from 16.9%. The company describes the period's economic backdrop as showing a gradual recovery but still clouded, notably by the situation in the Middle East, and says it continues to pursue its medium-term theme of "achieving measured growth through sustainable management of each group business."
Both core segments contract
Cosmetics, which accounts for 79.0% of revenue, saw sales fall 2.6% to ¥36,422 million and segment profit fall 9.9% to ¥8,084 million. Pharmaceuticals & Food fared worse in profit terms, with revenue down 4.4% to ¥8,002 million and segment profit down 24.6% to ¥562 million. Only the small Other segment grew, revenue up 10.4% to ¥1,650 million and profit up 13.5% to ¥155 million — not nearly enough to offset the rest. Note that segment profit sums to well above reported operating profit because unallocated corporate costs are deducted separately.
| Segment | Revenue (¥ million) | Revenue YoY | Share of revenue | Segment profit (¥ million) | Profit YoY |
|---|---|---|---|---|---|
| Cosmetics | 36,422 | -2.6% | 79.0% | 8,084 | -9.9% |
| Pharmaceuticals & Food | 8,002 | -4.4% | 17.4% | 562 | -24.6% |
| Other | 1,650 | +10.4% | 3.6% | 155 | +13.5% |
| Consolidated | 46,075 | -2.6% | 100.0% | 6,895 | -13.9% |
Cash rotated into securities; the dividend takes ¥7.9 billion out of equity
Total assets fell ¥2,991 million to ¥73,500 million, but the headline masks a portfolio shift rather than a shrinking business: cash and deposits dropped ¥12,701 million while securities holdings rose ¥9,946 million. Liabilities eased ¥293 million to ¥21,990 million, with income taxes payable down ¥511 million and long-term guarantee deposits received down ¥313 million against a ¥401 million rise in deferred tax liabilities. Net assets declined ¥2,698 million to ¥51,510 million: the ¥4,089 million of quarterly profit was more than absorbed by the ¥7,855 million prior-year-end dividend payment, leaving retained earnings ¥3,766 million lower, partly offset by a ¥753 million increase in the valuation difference on other securities. The equity ratio stood at 69.4%, down from 70.3% at the September year-end but still among the most conservative in Japanese consumer goods. Shares issued were unchanged at 34,156,623, with just 417 treasury shares.
Guidance unchanged — and the maths are demanding
Noevir made no change to the full-year forecast published on November 7, 2025: revenue of ¥65,000 million (+0.4%), operating profit of ¥11,400 million (+2.9%), recurring profit of ¥11,800 million (+0.2%) and profit attributable to owners of ¥8,200 million (+2.1%), for EPS of ¥240.07. That leaves a demanding fourth quarter. With ¥6,895 million of operating profit booked in nine months, the guidance implies roughly ¥4,505 million in the July–September quarter, against about ¥3,071 million in the same quarter last year — an increase of close to 47% at a time when the nine-month trend is down 13.9%. The dividend forecast is unchanged at ¥230.00 per share, paid entirely at the year-end, the same as FY9/2025. The quarterly consolidated statements were not reviewed by an accounting firm.
| Metric | 9M FY9/2026 | 9M FY9/2025 | YoY |
|---|---|---|---|
| Revenue (¥ million) | 46,075 | 47,283 | -2.6% |
| Operating profit (¥ million) | 6,895 | 8,008 | -13.9% |
| Operating margin (%) | 15.0 | 16.9 | -1.9pt |
| Recurring profit (¥ million) | 7,290 | 8,422 | -13.4% |
| Profit attributable to owners (¥ million) | 4,089 | 4,123 | -0.8% |
| Comprehensive income (¥ million) | 5,394 | 4,168 | +29.4% |
| EPS (¥) | 119.72 | 120.73 | -0.8% |
| Total assets (¥ million) | 73,500 | 76,492 | -3.9% |
| Net assets (¥ million) | 51,510 | 54,209 | -5.0% |
| Equity ratio (%) | 69.4 | 70.3 | -0.9pt |
| Annual dividend per share (¥) | 230.00 | 230.00 | unchanged |
| FY9/2026 guidance — revenue (¥ million) | 65,000 | — | +0.4% |
| FY9/2026 guidance — operating profit (¥ million) | 11,400 | — | +2.9% |
| FY9/2026 guidance — net profit (¥ million) | 8,200 | — | +2.1% |
JapanStockPulse provides informational content only and does not constitute investment advice. Figures are taken from the company’s published earnings short report and may be subject to subsequent revision.