A September year-end, and a nine months that closed in June
E-Guardian Inc. (TSE: 6050) disclosed consolidated results for the first nine months of the fiscal year ending September 2026 on August 3, 2026, under Japanese GAAP. The company's fiscal year ends on 30 September, not in March, so this cumulative third-quarter period runs from October 1, 2025 to June 30, 2026 — a point worth fixing before any comparison against the March-year names that dominate Japan's earnings calendar. The quarterly financial statements were not subject to an audit-firm review.
E-Guardian is an internet-security services group: it moderates user posts, runs customer support and reputation research for social web and other internet services, provides customer support and debugging for games, screens internet advertising and operates ad campaigns on clients' behalf, and sells cybersecurity — vulnerability diagnostics, web application firewalls and security consulting. It reports a single segment, the internet security business, and discloses revenue by service type instead. It is itself a subsidiary of Change Holdings, Inc., with whom it says it is working to become Japan's leading cybersecurity vendor, and it markets its operating model as a "hybrid of AI and people".
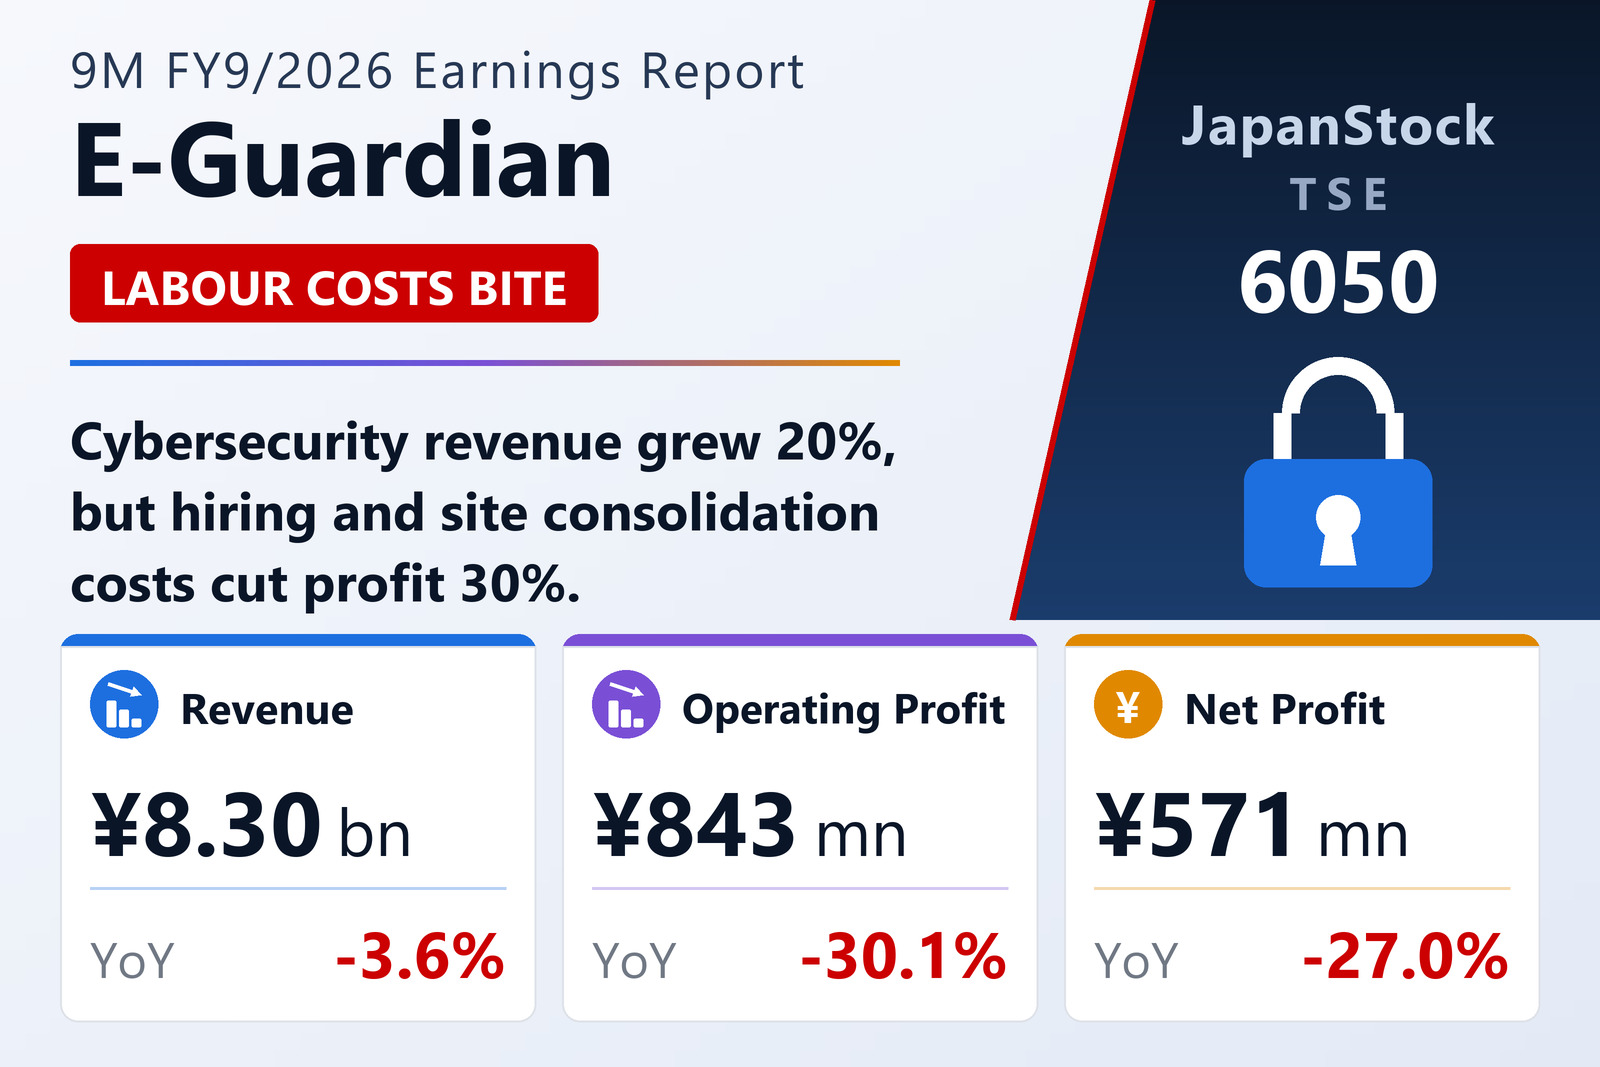
Revenue for the nine months was ¥8,300 million (¥8,300,182 thousand), down 3.6% from ¥8,609 million, which had itself grown 1.5% a year earlier. Operating profit fell 30.1% to ¥843 million (¥843,229 thousand) from ¥1,206 million. Ordinary profit fell 27.2% to ¥883 million and net profit attributable to owners of parent fell 27.0% to ¥570 million (¥570,752 thousand) from ¥781 million. Basic earnings per share came to ¥49.22 against ¥67.61; no diluted figure was reported, and a share-delivery trust for directors is treated as treasury stock in the weighted-average share count of 11,594,786. Comprehensive income was ¥580 million, down 25.8%.
Revenue down 3.6%, profit down 30% — the gap is entirely cost
The eight-times difference between the two decline rates is the story, and the income statement locates it precisely. Cost of sales fell 1.3% to ¥5,970 million while revenue fell 3.6%, so gross profit fell 8.9% — from ¥2,558 million to ¥2,329 million, a drop of ¥228.5 million. Selling, general and administrative expenses then went the other way, rising 10.0% to ¥1,486 million from ¥1,352 million, adding another ¥134.6 million. Together those two movements account for the ¥363.1 million fall in operating profit.
Management's explanation is that the per-project gross margin is genuinely improving as AI is deployed across the operating centres and embedded into the services themselves, but that personnel costs rose for three reasons at once: the use of temporary agency staff to stand up large new projects quickly, the temporary duplication of labour costs across multiple centres while sites were being closed and consolidated, and the recruitment of highly skilled specialists, AI talent included. That is a coherent account, but note what the consolidated numbers actually show: the group-level gross margin fell from 29.7% to 28.1%. Per-project margins improving while the aggregate margin declines is what a transition looks like when the transition costs still sit inside cost of sales — the improvement is real at the project level and not yet visible at the group level.
The operating margin fell from 14.0% to 10.2%. A change in accounting estimates takes a small further slice: during the second quarter the company fixed the exit timing for its Tachikawa and Koriyama centres, shortened useful lives so that depreciation completes over the remaining expected period of use, and revised its restoration-cost estimate to recognise the portion of deposits it no longer expects to recover. That reduced nine-month operating profit, ordinary profit and pre-tax profit by ¥13,149 thousand each — roughly ¥13 million, or about 3.6% of the ¥363 million profit decline. It is not the explanation, but it is part of it, and it is the accounting trace of the same centre consolidation that produced the duplicated labour costs.
Below the operating line the picture improves. Non-operating income more than tripled to ¥43,993 thousand from ¥13,977 thousand, driven by interest received of ¥30,393 thousand against ¥8,067 thousand a year earlier — the return on a balance sheet holding ¥10.6 billion of cash and deposits in a Japan that now pays for yen. Non-operating expenses nearly halved to ¥3,788 thousand as foreign-exchange losses eased. The result is that ordinary profit of ¥883 million exceeds operating profit of ¥843 million, and fell 27.2% rather than 30.1%. Extraordinary losses were negligible at ¥12 thousand, against ¥3,139 thousand of fixed-asset retirement losses a year earlier, and the effective tax rate was essentially unchanged at 35.4%.
Revenue has now risen for two consecutive quarters
The nine-month decline is a first-half problem that has stopped getting worse. Revenue from existing social-support customers declined over the first half, and a large game-support project won in the first half of the prior fiscal year came to an end — between them enough to put the cumulative line 3.6% behind. But third-quarter revenue on its own was ¥2,835 million, above the second quarter's ¥2,820 million, which the company describes as a second consecutive quarterly increase. Backing that out of the cumulative total puts the first quarter at roughly ¥2,645 million, so the quarterly path reads ¥2,645 million, ¥2,820 million, ¥2,835 million.
Three things are credited with the turn, and all three are the same story from different angles: major customers expanded the volume of work they place, AI was deployed into engagements the company already held — widening the scope of work it handles on those accounts — and new projects were won on the premise that AI-enabled services would deliver them. In other words the AI investment that is currently depressing the margin is also what is being sold. The sequential improvement is modest in absolute terms, ¥15 million between the second and third quarters, and one quarter of direction is not a trend; two is the beginning of one.
Cybersecurity is the only service line growing
With a single reportable segment, the useful disaggregation is by service type. The company discloses five lines, and they sum to consolidated revenue, so this is a complete breakdown rather than a selection.
Social Support — post moderation, customer support and reputation research — remains the core at ¥5,356 million, down 1.8% and roughly 65% of group revenue. Inside it, customer support and identity-verification work for e-commerce and flea-market sites rose while social-network monitoring fell; third-quarter revenue rose against the second quarter as a major customer expanded, AI deployment widened the company's scope on existing accounts, and new AI-premised projects were won. Game Support — customer support and debugging, mainly for social games — was the worst line at ¥826 million, down 24.2%: the sales organisation, reorganised by service category, did lift new-customer revenue, but not enough to cover the ended large prior-year project plus lower revenue from existing customers. Ad Process, internet-ad screening and ad-operations outsourcing, fell 8.3% to ¥887 million on the same pattern — new customers won, existing customers shrinking faster.
Cybersecurity is the exception and the reason the group calls it a growth field: revenue rose 19.6% to ¥812 million. The composition matters. Vulnerability diagnostics stalled as market needs shifted, so none of the growth came from the group's longest-standing security product; instead both cloud-type and software-type web application firewall revenue rose, and consulting grew on a single large win driven by rising security demand in the face of cyber attacks. Growth concentrated in one large consulting engagement is worth less than the same growth spread across many, and a stalled diagnostics business is a signal about product-market fit rather than about budget. The fifth line, Other — hardware debugging, run through wholly owned EG Testing Service Inc. — was flat at ¥419 million, up 0.1%.
At ¥812 million against ¥5,356 million, cybersecurity is not yet large enough to move the group. Growing 19.6% on that base adds about ¥133 million of revenue; Game Support alone shed roughly ¥264 million. That arithmetic is the whole problem with the current mix: the shrinking lines are still several times the size of the growing one.
OSCOM takes the group outbound — and contributed nothing to these numbers
Two corporate actions changed the consolidation scope during the period, one in each direction. E-Guardian Tohoku Inc., a wholly owned subsidiary, was absorbed by merger on April 1, 2026, a common-control transaction intended to centralise management resources, speed up decision-making and improve operating efficiency. And on June 1, 2026 the company acquired 100% of Outsourcing Communications Inc. ("OSCOM"), a contact-centre operator, for ¥290,000 thousand in cash plus ¥4,500 thousand of advisory and related costs, taking the group into the outbound calling field for the first time. The share-transfer agreement had been disclosed on May 22, 2026. Provisional goodwill on the acquisition is ¥145,648 thousand; the identification of acquired assets and liabilities and the allocation of acquisition cost were not complete at the quarter end, so the accounting is provisional and the amortisation period is still being determined.
One detail materially changes how the acquisition should be read against these results: the deemed acquisition date is June 30, 2026 — the last day of the period. Only OSCOM's balance sheet is consolidated; none of its revenue or profit appears in the nine-month income statement at all. Whatever OSCOM contributes, it contributes from the fourth quarter onwards, and these figures contain none of it. The strategic case the company makes is broader than one deal: it describes an "AI-BPO" model that layers AI onto its accumulated operational data and know-how, then adds the judgement of experienced people, and it wants to extend that model from reputation research, post moderation and customer support into back office, security and network management, and sales and marketing — escaping a labour-intensive cost structure in the process. OSCOM, and the outbound calling capability it brings, is presented as the first strategic step.
An unchanged guide that now needs an outsized fourth quarter
Full-year FY9/2026 guidance was left unchanged from the November 7, 2025 announcement: revenue of ¥12,009 million (up 6.1%), operating profit of ¥1,604 million (up 6.7%), ordinary profit of ¥1,629 million (up 6.5%), net profit of ¥1,033 million (up 9.6%) and earnings per share of ¥89.36. This is the figure to interrogate, because the arithmetic of what remains is stark.
Nine months in, revenue stands at 69.1% of the full-year target, operating profit at 52.6%, ordinary profit at 54.2% and net profit at 55.2% — against the 75% a straight-line year would show at this point. Read forward, the guide implies a fourth quarter delivering ¥3,709 million of revenue, some 30.8% more than the third quarter's ¥2,835 million and the highest quarterly figure in the group's recent history, and ¥761 million of operating profit: 47% of the full-year target in one quarter, and almost as much as the ¥843 million earned across the preceding three combined. That works out to a fourth-quarter operating margin near 20.5% against 10.2% for the nine months. Ordinary profit would need ¥746 million and net profit ¥463 million on the same basis.
The obvious swing factor is OSCOM, newly consolidated and contributing to the income statement for the first time in the fourth quarter — but the scale should be weighed honestly. The entire equity of OSCOM was bought for ¥290 million, and it generated ¥146 million of goodwill; a business acquired for that price is unlikely on its own to add the ¥874 million of sequential revenue the guide implies. The remaining candidates are the sequential momentum the company has now shown for two quarters, the seasonal shape of a September-year business, the reversal of the duplicated centre costs once the Tachikawa and Koriyama exits complete, and the maturing of the large cybersecurity consulting win. Whether those combine to close a gap of this size is not something these figures settle, and the company neither revised the guide nor explained the fourth-quarter step-up. Investors should treat the unchanged guidance as the company's stated position rather than as a validated forecast, and note that the accounting-estimate change already recognised in these nine months at least removes one drag from the quarter ahead.
Balance sheet: a 90.2% equity ratio and a dividend raised to ¥38.00
The balance sheet is unusually clean. Total assets fell 1.3% to ¥13,545 million from ¥13,728 million at the September 2025 year-end. Current assets fell ¥311.7 million (2.5%) to ¥12,066 million — accounts receivable rose ¥45.4 million while cash and deposits fell ¥380.7 million — and non-current assets rose ¥128.9 million (9.5%) to ¥1,479 million, chiefly ¥73.5 million of added goodwill from the OSCOM acquisition and ¥21.4 million of property, plant and equipment.
Liabilities fell hard, down ¥354.1 million or 21.1% to ¥1,321 million: unpaid and other current payables rose ¥29.5 million, against a ¥59.0 million reduction in the provision for bonuses and a ¥193.6 million fall in income taxes payable — the latter a direct consequence of lower profit. Net assets rose ¥171.3 million (1.4%) to ¥12,224 million, the net profit of ¥570.8 million less ¥411.6 million of dividends paid. With almost no debt against ¥10.6 billion of cash, the equity ratio rose to 90.2% from 87.8% — a capital structure that gives the company considerable room to absorb a transition year, and one reason the profit decline is a margin question rather than a solvency question. No quarterly consolidated cash flow statement was prepared; disclosed non-cash charges were ¥63,163 thousand of depreciation, ¥72,190 thousand of goodwill amortisation and ¥31,456 thousand of other amortisation.
On shareholder returns, the FY9/2026 dividend forecast is ¥38.00 per share, paid entirely at the year-end with no interim payment, up from ¥35.00 for FY9/2025 — an increase of 8.6%, and unrevised from the previous announcement. Against forecast EPS of ¥89.36 that is a payout ratio of about 42.5%; against the nine-month EPS run rate actually delivered, it is a good deal more. On the macro backdrop, management describes a Japanese economy recovering moderately as activity normalises and employment and incomes improve, with US trade policy and Middle East geopolitical risk clouding the outlook, while video streaming, e-commerce and fintech services keep expanding and cybersecurity problems — security anxiety from entrenched remote work, supply-chain cyber risk — grow more numerous and more serious each year.
| Metric | 9M FY9/2026 | 9M FY9/2025 | Change |
|---|---|---|---|
| Revenue (¥ million) | 8,300 | 8,609 | −3.6% |
| Gross profit (¥ million) | 2,329 | 2,558 | −8.9% |
| Gross margin | 28.1% | 29.7% | −1.6 pt |
| SG&A expenses (¥ million) | 1,486 | 1,352 | +10.0% |
| Operating profit (¥ million) | 843 | 1,206 | −30.1% |
| Operating margin | 10.2% | 14.0% | −3.9 pt |
| Ordinary profit (¥ million) | 883 | 1,213 | −27.2% |
| Net profit attrib. to owners of parent (¥ million) | 570 | 781 | −27.0% |
| Comprehensive income (¥ million) | 580 | 781 | −25.8% |
| Basic EPS (¥) | 49.22 | 67.61 | −27.2% |
| Total assets (¥ million; vs Sep 30, 2025) | 13,545 | 13,728 | −1.3% |
| Net assets (¥ million; vs Sep 30, 2025) | 12,224 | 12,053 | +1.4% |
| Equity ratio (vs Sep 30, 2025) | 90.2% | 87.8% | +2.4 pt |
| Dividend per share (¥; FY9/2026 forecast vs FY9/2025 actual) | 38.00 | 35.00 | +8.6% |
JapanStockPulse provides informational content only and does not constitute investment advice. Figures are taken from the company's published earnings short report and may be subject to subsequent revision.