The rate cycle arrives in the profit line
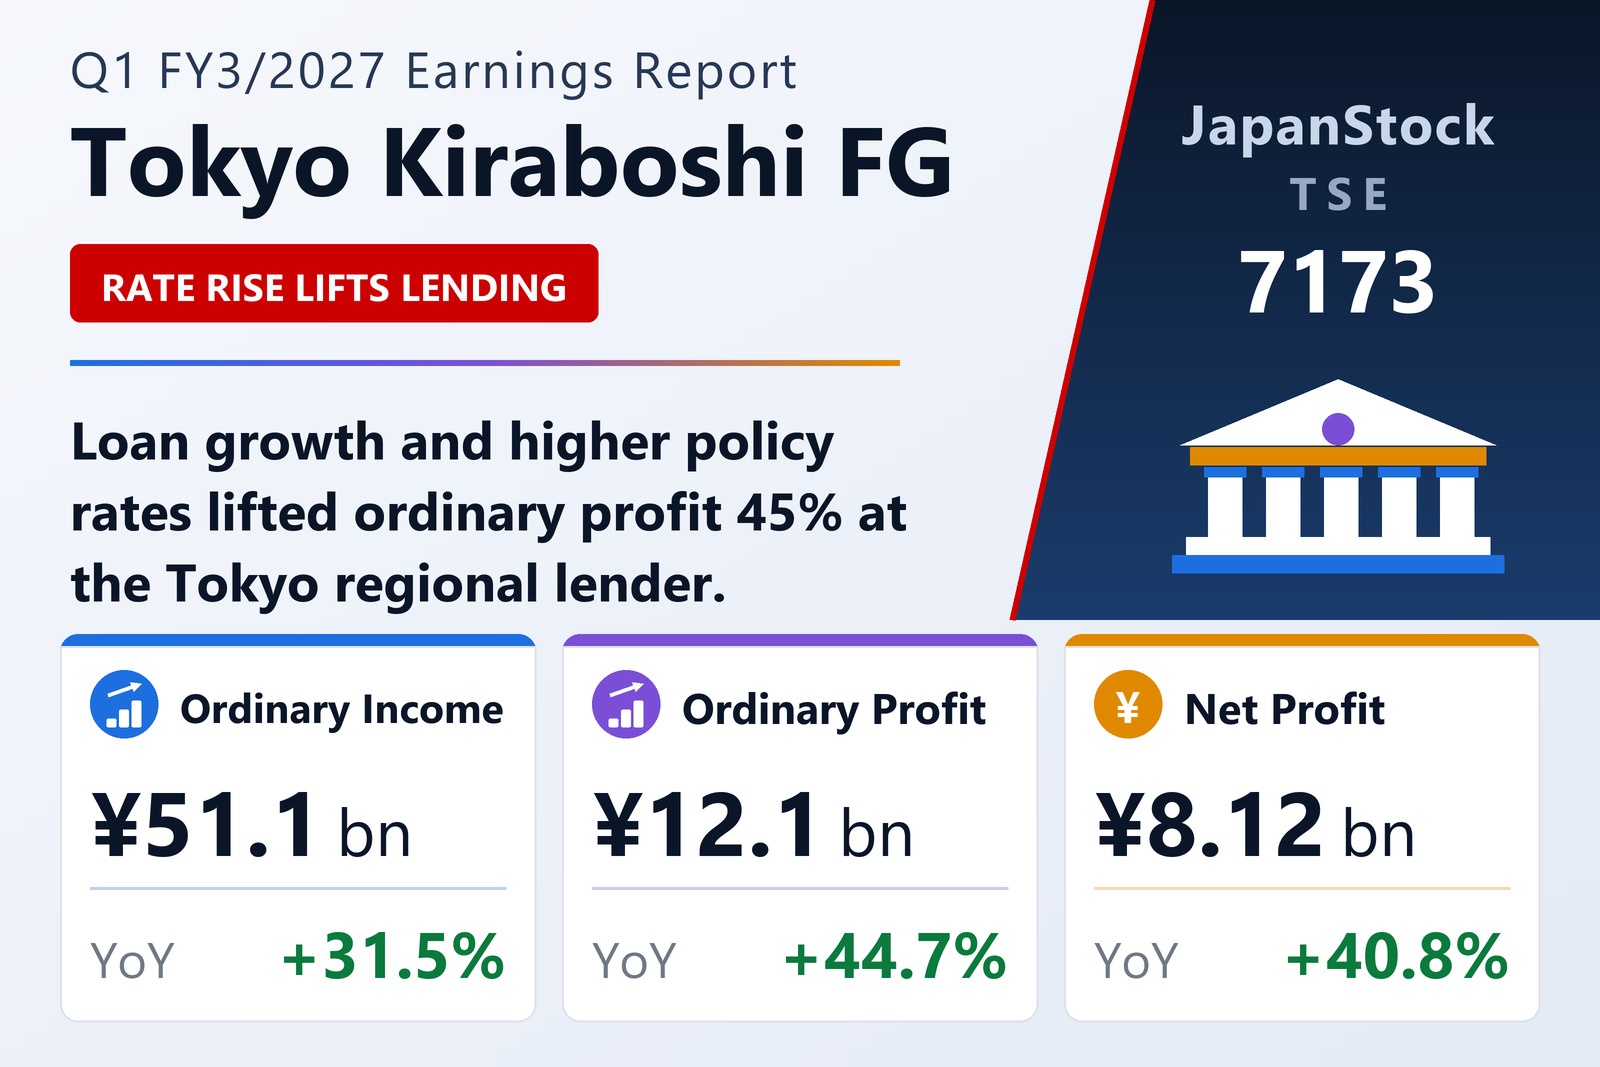
Tokyo Kiraboshi Financial Group, Inc. (TSE: 7173), the Tokyo-based regional banking group whose principal subsidiary is Kiraboshi Bank, disclosed consolidated first-quarter results for the fiscal year ending March 2027 — April 1 to June 30, 2026 — under Japanese GAAP on August 3, 2026. Ordinary income, the banking-sector equivalent of revenue, reached ¥51,098 million, up 31.5% from ¥38,854 million. Ordinary profit rose 44.7% to ¥12,061 million from ¥8,332 million, and net profit attributable to owners of parent rose 40.8% to ¥8,121 million from ¥5,765 million. Comprehensive income came in at ¥14,803 million, up 37.0% from ¥10,804 million.
Those growth rates deserve their comparator. In the same quarter a year earlier ordinary income was exactly flat at 0.0%, ordinary profit fell 13.7% and net profit fell 11.4% — so this quarter's rebound is measured against a soft base rather than a strong one. On a returns basis the improvement is nonetheless clear: return on equity computed on attributable quarterly profit reached 7.95%, up 1.79 percentage points from 6.16%.
Per-share figures are restated throughout for the eight-for-one common stock split the group carried out with a record date of June 30, 2026 and an effective date of July 1, 2026, calculated as though the split had taken place at the start of the prior fiscal year. On that basis basic earnings per share were ¥30.99 against ¥23.85, and diluted earnings per share ¥26.77 against ¥16.99. The gap between the two narrowed sharply — from 28.8% dilution a year ago to 13.6% this quarter — because the convertible preferred shares responsible for most of that dilution were converted and cancelled during the quarter, a point taken up below.
How Kiraboshi Bank found an extra ¥3.2 billion
Almost all of the group's earnings come from Kiraboshi Bank. On a non-consolidated basis the bank's ordinary profit was ¥11,039 million, up ¥3,223 million or 41.2%, and its quarterly net profit ¥7,559 million, up ¥2,048 million. The group's reported figures sit above the bank's — ¥12,061 million and ¥8,121 million — after consolidation adjustments including the elimination of intragroup transactions, with the earnings of the non-bank subsidiaries added on top.
Management's own breakdown of the bank's year-on-year movement is where the rate cycle shows up most plainly. Loan interest added ¥2.9 billion, as the promotion of main-bank relationships and stronger customer relationships grew the loan book while loan yields rose with the higher policy rate. Interest and dividends on securities added ¥0.6 billion, including ¥0.5 billion of higher fund income. Non-interest income added ¥2.6 billion, chiefly because hedging costs on yen bonds fell. Gains and losses on bonds and equities added ¥0.7 billion on balance: losses on bond sales grew, but gains on the sale of pure-investment equities grew by more. Against those, other funding-related income cost ¥1.9 billion as deposit interest expense rose with rates, credit costs cost ¥1.3 billion through loan-loss provisions on the credit deterioration of some large borrowers, and expenses cost ¥0.3 billion on higher outsourcing and other non-personnel costs. The positives sum to ¥6.8 billion and the negatives to ¥3.5 billion, reconciling to the ¥3.2 billion increase in ordinary profit.
The gross-versus-net distinction matters here. Loan interest income itself climbed to ¥23.5 billion from ¥20.6 billion, but interest on deposits and other funding widened to ¥5.9 billion from ¥3.7 billion, so net interest on loans and deposits rose only ¥0.6 billion, to ¥17.6 billion. The larger single swing came from the non-interest line, where other operating profit turned to a ¥0.5 billion profit from a ¥1.5 billion loss as yen-bond hedging costs fell, and fee and commission income rose to ¥3.0 billion from ¥2.4 billion. Cost discipline compounded the effect: the bank's overhead ratio on a core gross-profit basis improved to 58.05% from 68.49%, and core net business profit rose to ¥10.6 billion from ¥6.6 billion. The offset is credit quality — the bank's credit costs rose to ¥1,623 million from ¥313 million, disclosed claims under the Financial Reconstruction Act reached ¥88,191 million or 1.74% of total credit against 1.71% at March 31, and bankrupt and quasi-bankrupt claims rose ¥2,990 million to ¥15,031 million.
A ¥40 billion capital cleanup shrank net assets
The quarter's most consequential balance-sheet event was not earnings. Conversion rights over all of the Class 1 Type 1 preferred shares were exercised on May 19 and May 27, 2026, creating 5,498,532 additional common shares, and those preferred shares were then cancelled in full on May 27. All of the Type 2 preferred shares were cancelled in full on May 25. Separately, under a board resolution of May 8, the group acquired 2,000,000 of its own shares on May 25 and cancelled them the same day, reducing capital surplus by ¥40,000 million to ¥111,099 million from ¥151,099 million.
That arithmetic flows straight through the equity section. Net assets fell ¥28,116 million to ¥395,324 million from ¥423,440 million, even though retained earnings rose ¥5,221 million to ¥241,148 million and accumulated other comprehensive income rose to ¥16,703 million from ¥10,025 million. Shareholders' equity dropped to ¥378,544 million from ¥413,344 million; the equity figure the company uses for its own ratio disclosure was ¥395,247 million. After the split the share count reads very differently: 289,189,176 shares issued against 245,200,920 at the March year-end, both restated for the split, with 2,951,088 treasury shares and a weighted average of 262,065,287 for the quarter.
The cost of the cleanup shows up in the regulatory ratio, and that is the figure to watch. The group's consolidated capital adequacy ratio on the domestic standard fell to 8.56% from 9.54% — capital dropped ¥32,205 million to ¥353,461 million while risk assets rose ¥85,965 million to ¥4,124,503 million, so both halves of the fraction moved the wrong way at once. The ratio still sits comfortably above the 4% minimum implied by the ¥164,980 million total capital requirement, and Kiraboshi Bank's own non-consolidated ratio barely moved, at 9.00% against 9.10%. The group has traded roughly a point of headroom for a permanently simpler capital structure and about ¥0.6 billion a year of preferred dividends it no longer has to pay.
Securities drove a ¥226.9 billion balance-sheet expansion
Total assets grew ¥226.9 billion to ¥7,544.3 billion. Deposits rose ¥138.3 billion to ¥6,323.8 billion and loans rose ¥87.3 billion to ¥5,364.8 billion, but the largest mover by far was securities, up ¥163.3 billion — 18.6% in three months — to ¥1,041.4 billion. The funding for that came less from deposits than from the wholesale book: cash collateral received on securities lending transactions jumped to ¥289,675 million from ¥108,051 million, while negotiable certificates of deposit fell to ¥345,200 million from ¥403,200 million and cash and due from banks fell to ¥792,517 million from ¥826,022 million. The equity ratio the company discloses fell to 5.2% from 5.7%; the filing is explicit that this figure is net assets less subscription rights and non-controlling interests divided by total assets, and is not the regulatory capital-adequacy ratio.
Growing a securities book in a rising-rate market carries a visible mark-to-market cost. Net unrealized losses on other securities stood at ¥27,833 million at June 30, against ¥25,549 million a year earlier — a ¥27,866 million unrealized gain on equities set against a ¥42,272 million unrealized loss on bonds and a ¥13,426 million loss on other holdings, with a further ¥1,212 million unrealized loss on held-to-maturity bonds. The equity gains are the reservoir the bank has been drawing on: the ¥4.4 billion of gains on equity-related transactions this quarter, against ¥0.7 billion a year earlier, came out of exactly that pool. Elsewhere in the group, digital bank UI Bank grew its loan book to ¥330,511 million from ¥268,640 million in three months and lifted its own capital ratio to 7.76% from 6.59%, while assets under custody across Kiraboshi Bank and Kiraboshi Life Design Securities passed ¥1 trillion at ¥1,008,636 million, up ¥273,138 million year on year.
Guidance unchanged — and it still points down
The group left the FY3/2027 forecast it published on May 8 entirely unchanged. For the first half it guides to ordinary profit of ¥26,100 million, down 5.5%, net profit of ¥17,700 million, down 7.9%, and earnings per share of ¥64.88. For the full year: ordinary profit of ¥58,600 million, down 3.1%, net profit of ¥40,000 million, down 5.5%, and earnings per share of ¥143.11. Absent the stock split those per-share figures would read ¥519.08 and ¥1,144.88. After one quarter the group stands at 20.5% of the ordinary-profit target and 20.3% of the net-profit target.
A quarter that grew 44.7% inside a year guided to decline 3.1% needs explaining, and the answer lies in the comparator rather than in this quarter. The guided declines imply FY3/2026 actuals of roughly ¥60.5 billion of ordinary profit and ¥42.3 billion of net profit; last year's first quarter contributed only about 13.6% of that net figure, so the prior year was heavily back-loaded. Run the same arithmetic on the half-year guide and it implies a prior-year second quarter of roughly ¥13.5 billion of net profit against a guided ¥9.6 billion this time — a step down of nearly 30% concentrated in the quarter now under way. Either that comparator quarter contained something that does not repeat, or the guidance is conservative; the company has offered no revision either way, and one quarter at a fifth of the annual target is not yet evidence for either reading.
Dividend up 41% on a comparable basis as preferred payouts end
The common dividend forecast for FY3/2027 is ¥30.00 per share post-split, split ¥15.00 at the interim and ¥15.00 at year-end, unrevised from the previous announcement. FY3/2026 paid ¥170.00 in total (¥85.00 plus ¥85.00), which restates to ¥21.25 on the new share basis — so the forecast is an increase of ¥8.75, or 41.2%, on a comparable basis, and implies a payout ratio of about 21% against guided earnings per share of ¥143.11.
The preferred dividends disappear entirely. The Class 1 Type 1 preferred paid ¥193.00 twice in FY3/2026, ¥386.00 for the year, at a rate of 12-month JPY TIBOR plus 1.1% — TIBOR was 0.82818% on April 1, 2025 — on 750,000 shares with a paid-in amount of ¥20,000 each. The Type 2 preferred paid ¥82.818 per half, ¥165.636 for the year, at TIBOR plus 0.0% on 2,000,000 shares. With both series cancelled, no preferred dividend is forecast for FY3/2027, removing roughly ¥0.6 billion of annual payments that ranked ahead of the common stock.
Three reporting notes for completeness. There was no significant change in the scope of consolidation. The group did change an accounting policy following a revision of accounting standards, applying the amended Practical Guidelines on Accounting for Financial Instruments from the start of this quarter so that certain unlisted shares held within partnership-type investments are now measured at fair value; the company describes the effect on the quarterly statements as immaterial. And the attached quarterly consolidated financial statements were not reviewed by an accounting auditor. No quarterly consolidated cash flow statement was prepared; depreciation for the quarter was ¥1,860 million and goodwill amortization ¥125 million. The company reported no material subsequent events.
| Metric | Q1 FY3/2027 | Q1 FY3/2026 | Change |
|---|---|---|---|
| Ordinary income (¥ million) | 51,098 | 38,854 | +31.5% |
| Ordinary profit (¥ million) | 12,061 | 8,332 | +44.7% |
| Net profit attrib. to owners of parent (¥ million) | 8,121 | 5,765 | +40.8% |
| Comprehensive income (¥ million) | 14,803 | 10,804 | +37.0% |
| Basic EPS (¥, split-adjusted) | 30.99 | 23.85 | +29.9% |
| Diluted EPS (¥, split-adjusted) | 26.77 | 16.99 | +57.6% |
| Kiraboshi Bank ordinary profit (¥ million) | 11,039 | 7,816 | +41.2% |
| Kiraboshi Bank net profit (¥ million) | 7,559 | 5,511 | +37.2% |
| ROE (attributable-profit basis) | 7.95% | 6.16% | +1.79 pt |
| Overhead ratio (core gross-profit basis) | 58.05% | 68.49% | -10.44 pt |
| Total assets (¥ million; vs Mar 31, 2026) | 7,544,298 | 7,317,357 | +3.1% |
| Deposits (¥ million; vs Mar 31, 2026) | 6,323,795 | 6,185,446 | +2.2% |
| Loans (¥ million; vs Mar 31, 2026) | 5,364,791 | 5,277,513 | +1.7% |
| Securities (¥ million; vs Mar 31, 2026) | 1,041,398 | 878,090 | +18.6% |
| Net assets (¥ million; vs Mar 31, 2026) | 395,324 | 423,440 | -6.6% |
| Equity ratio (company basis; vs Mar 31, 2026) | 5.2% | 5.7% | -0.5 pt |
| Capital adequacy ratio (domestic standard; vs Mar 31, 2026) | 8.56% | 9.54% | -0.97 pt |
JapanStockPulse provides informational content only and does not constitute investment advice. Figures are taken from the company's published earnings short report and may be subject to subsequent revision.