Profit up 79% on revenue up 2%
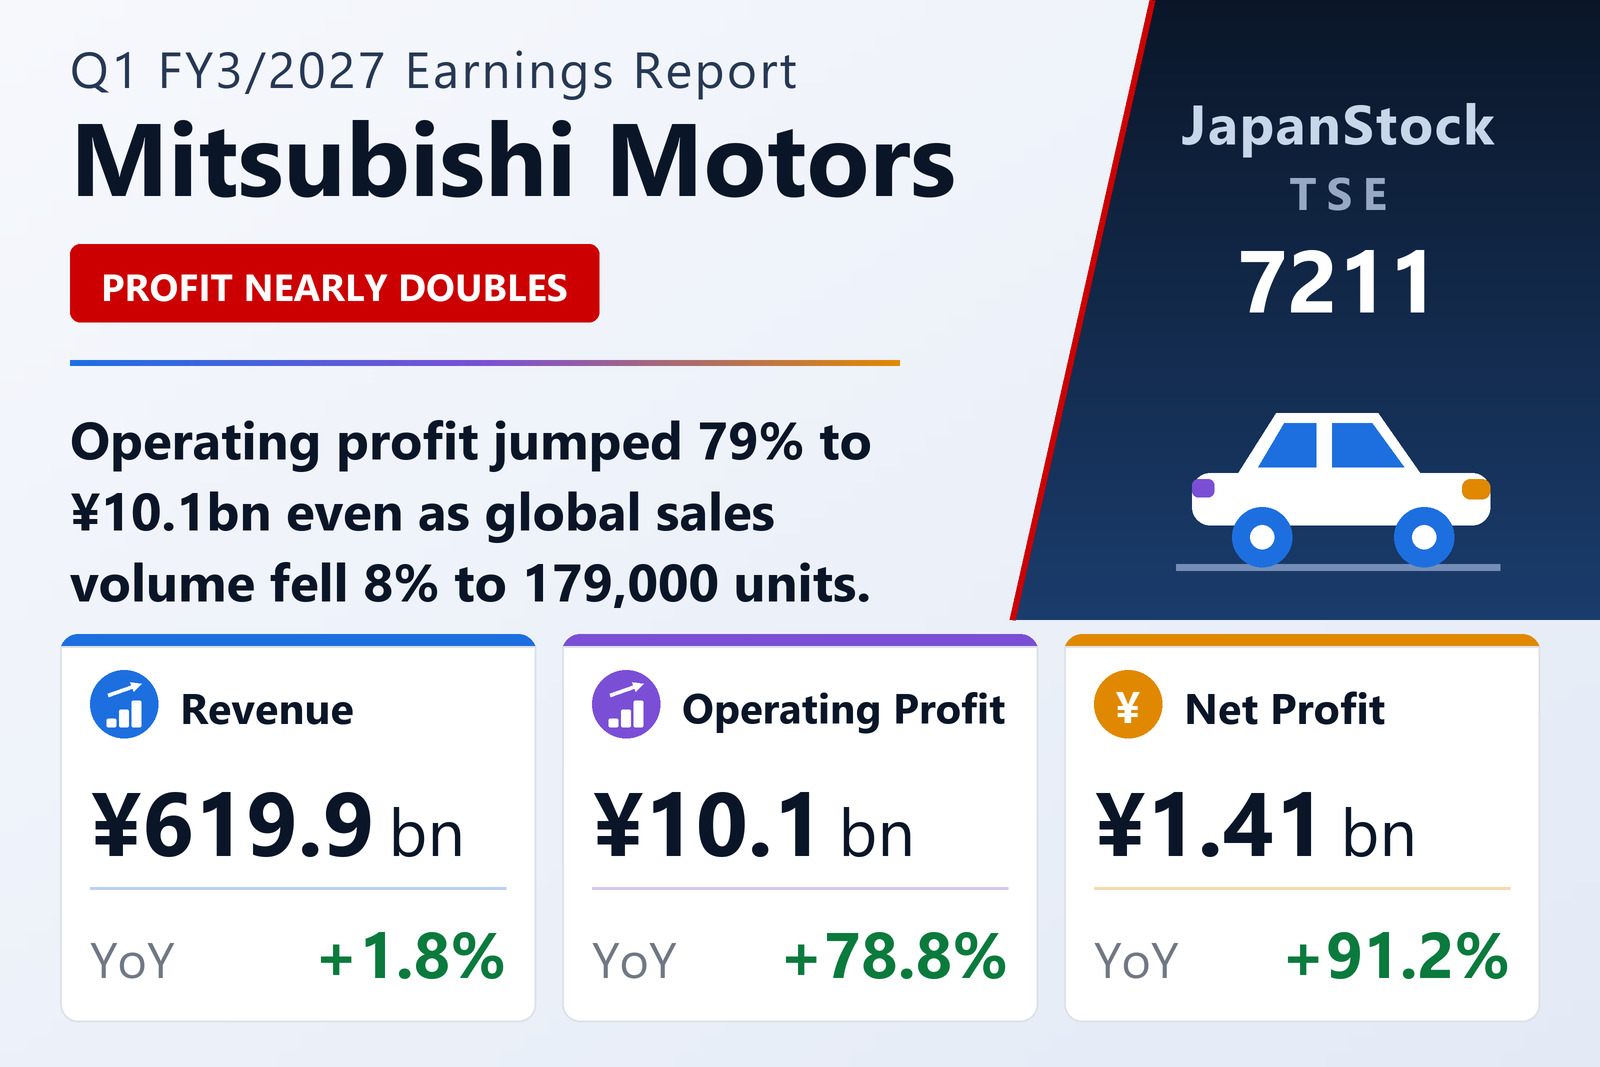
Mitsubishi Motors Corporation (TSE: 7211) disclosed consolidated results for the first quarter of the fiscal year ending March 2027 — April 1 to June 30, 2026 — under Japanese GAAP on August 3, 2026. Revenue came in at ¥619,863 million, up 1.8% year on year from ¥609,091 million. Operating profit rose 78.8% to ¥10,082 million from ¥5,638 million, ordinary profit rose 101.3% to ¥9,740 million from ¥4,839 million, and profit attributable to owners of parent rose 91.2% to ¥1,411 million from ¥738 million. Basic earnings per share were ¥1.05 against ¥0.55, with diluted EPS identical at ¥1.05.
Comprehensive income swung to a positive ¥4,974 million from a loss of ¥1,265 million a year earlier, driven almost entirely by the foreign currency translation adjustment, which contributed a positive ¥2,492 million this quarter against a negative ¥3,952 million in the prior-year period. The context for all of these percentages matters: the comparative quarter was a weak one, with revenue down 2.9% and operating profit down 84.1% year on year at the time. Measured against the base rather than the growth rate, an operating margin of 1.63% — up from 0.93% — is still thin for a volume automaker.
Eight percent fewer cars, and roughly a tenth more revenue per car
The operating environment described in the filing was uniformly difficult. Middle East tensions, persistently high fuel prices and rising interest rates softened demand in the Middle East, ASEAN and Australia, and market competition intensified. Global retail volume fell 8% year on year to 179,000 units. Management's account of the response is brief: agile sales activity and earnings-improvement measures.
The arithmetic is what makes the quarter interesting. Revenue rose 1.8% while units sold fell 8%, which implies average revenue per unit roughly a tenth higher than a year earlier. That is a mix and pricing story rather than a demand story, and the regional revenue disclosure shows exactly where it came from. North America generated ¥179,765 million of external revenue, up 21.0%, overtaking Japan to become the group's largest single region. Japan followed at ¥162,904 million, up 9.2%, and Oceania at ¥62,658 million, up 2.5%. Against that, Asia fell 14.5% to ¥109,202 million, Other — chiefly Brazil and the U.A.E. — fell 12.8% to ¥79,828 million, and Europe fell 17.3% to ¥25,503 million, a region now reduced to a single named market, Germany, from Germany, Spain and the Netherlands a year earlier. The regional table corroborates the management commentary line for line: ASEAN sits inside Asia, the Middle East inside Other.
Where the ¥4.4 billion of extra operating profit came from
Operating profit improved by ¥4,444 million, and the cost lines explain most of it. Cost of sales rose only 0.9% to ¥519,407 million against revenue up 1.8%, lifting gross profit 6.7% to ¥100,455 million and the gross margin to 16.2% from 15.5%. Selling, general and administrative expenses rose a contained 2.1% to ¥90,373 million — but the composition inside that total is worth attention. Research and development spending fell 9.7% to ¥15,437 million from ¥17,104 million, a ¥1,667 million reduction that is on its own more than a third of the entire operating-profit improvement. Advertising rose 11.1% to ¥11,847 million and freight rose 5.3% to ¥21,400 million, both consistent with pushing product in a competitive market. Depreciation, including amortisation of intangibles other than goodwill, rose 16.0% to ¥21,934 million, so the asset base is not being starved even as R&D is trimmed.
By segment, the automotive business supplied all of the improvement and slightly more. Automotive revenue including intersegment sales was ¥609,769 million, up ¥9.0 billion or 1.5%, and segment profit was ¥9,578 million, up ¥4.6 billion or 93.3%. Financial services grew faster on the top line, with revenue of ¥15,147 million, up ¥2.0 billion or 15.4%, but segment profit went the other way, down 16.0% to ¥620 million. Intersegment eliminations cost a further ¥60 million relative to the prior year. The three reconcile exactly to the reported ¥4,444 million improvement — automotive contributing ¥4,622 million, financial services giving back ¥118 million and eliminations ¥60 million.
Below the operating line, tax and minorities take almost all of it
Non-operating items improved. Non-operating income of ¥4,953 million against ¥3,444 million included a foreign exchange gain of ¥1,181 million, where the prior-year quarter carried a ¥495 million exchange loss, though interest income slipped to ¥1,985 million from ¥2,241 million. Non-operating expenses of ¥5,294 million against ¥4,243 million included interest expense up to ¥1,709 million from ¥1,317 million and a new ¥1,447 million of litigation-related expenses with no prior-year counterpart; the equity-method investment loss narrowed to ¥330 million from ¥674 million. Net non-operating drag therefore shrank to ¥341 million from ¥799 million, which is what carried ordinary profit past the doubling mark.
Below that, the comparison reverses. Extraordinary income was only ¥239 million against ¥2,666 million a year earlier, because the prior-year quarter booked a ¥2,500 million gain on the sale of investment securities that has no echo this year; extraordinary losses were ¥995 million against ¥728 million. Profit before income taxes therefore rose just 32.6% to ¥8,985 million — a third of the ordinary-profit growth rate, and purely an artefact of that one-off. Income taxes of ¥5,484 million represent an effective rate of 61.0%, up from 50.2%, computed under the quarterly convention of applying an estimated annual effective rate. Quarterly net profit consequently rose only 3.7% to ¥3,500 million. The headline 91.2% growth in attributable profit is partly a function of the minority slice shrinking: non-controlling interests absorbed ¥2,089 million against ¥2,638 million, leaving ¥1,411 million for the parent. Investors should note that the quarterly consolidated financial statements were not reviewed by an accounting auditor.
Balance sheet shrinks ¥105 billion as payables unwind
Total assets fell ¥104,670 million to ¥2,313,475 million at June 30, 2026 from ¥2,418,145 million at the March year-end. The single biggest move was cash and deposits, down ¥131,858 million to ¥307,033 million, alongside a ¥37,162 million fall in notes and accounts receivable. Working against those, sales finance receivables rose ¥7,285 million to ¥336,252 million and inventories rose ¥46,840 million to ¥435,232 million, of which merchandise and finished goods alone accounted for a ¥44,107 million increase to ¥329,344 million — a build that is worth watching in a quarter when unit sales fell 8%.
Liabilities fell ¥102,995 million to ¥1,351,832 million, driven by a ¥78,582 million reduction in notes and accounts payable to ¥368,561 million and a ¥12,561 million reduction in electronically recorded obligations. That is the cash outflow in mirror image: the group paid down its trade book. Meanwhile interest-bearing debt rose ¥18.2 billion to ¥413.6 billion, with short-term borrowings up ¥46,387 million to ¥116,288 million against long-term borrowings down ¥19,020 million — a shortening of the maturity profile rather than a net deleveraging.
Net assets were essentially flat at ¥961,643 million, down ¥1,675 million, with shareholders' equity at ¥916,256 million. Retained earnings actually fell ¥5,291 million to ¥445,723 million, because the ¥5.00 year-end dividend — roughly ¥6.7 billion of cash on the weighted-average share count — exceeded the ¥1,411 million of attributable profit earned in the quarter. The equity ratio improved to 39.6% from 38.0%, but that 1.6-point gain is arithmetic from a balance sheet that shrank 4.3% while equity fell only 0.3%; it is not accumulated earnings. No quarterly consolidated cash flow statement was prepared for the period.
Guidance untouched — and it implies a very heavy remaining nine months
Full-year guidance for FY3/2027 is unchanged from the figures published with the FY3/2026 results on May 8, 2026: revenue of ¥3,260,000 million, up 12.5%; operating profit of ¥90,000 million, up 19.2%; ordinary profit of ¥80,000 million, up 1.4%; and profit attributable to owners of parent of ¥25,000 million, up 149.6%, for EPS of ¥18.68.
Read against the quarter just reported, that guidance is demanding on one line in particular. Revenue is 19.0% of the full-year target after a quarter that is normally worth around a fifth of the year — last year's first quarter was 21.0% of the eventual full-year figure. The implied ¥12.5% full-year growth requires roughly ¥362 billion of additional revenue over FY3/2026's ¥2,897.8 billion, and Q1 delivered only ¥10.8 billion of it, about 3%. The remaining nine months must average roughly ¥880 billion of revenue per quarter, some 42% above the ¥619.9 billion just posted.
The profit lines look better than that. Operating profit is 11.2% of its target versus a comparable 7.5% share of the prior year's ¥75.5 billion actual, and ordinary profit is 12.2% of target — so on profitability the quarter is running ahead of last year's seasonal shape, even if the back half is still doing most of the work. Attributable profit is the weakest at 5.6% of target, needing roughly ¥7.9 billion per quarter for the rest of the year against ¥1.4 billion just booked. One structural point in the guidance deserves flagging: ordinary profit is guided up only 1.4% while operating profit is guided up 19.2%, which implies about ¥10 billion of net non-operating expense this year against ¥3.4 billion of net non-operating income last year — a ¥13.4 billion swing management has already built into the plan.
On shareholder returns, the FY3/2027 dividend forecast is ¥10.00 per share, split ¥5.00 interim and ¥5.00 year-end, unchanged from the previous announcement and level with the ¥10.00 paid for FY3/2026. On guided EPS of ¥18.68 that is a payout ratio of about 53.5%. There was no revision to the dividend forecast. Shares issued stood at 1,460,476,846 with 121,897,861 held in treasury, down slightly from 122,124,170, and the weighted-average count for the quarter was 1,338,444,636. There was no significant change in the scope of consolidation and no change in accounting policies or estimates.
| Metric | Q1 FY3/2027 | Q1 FY3/2026 | Change |
|---|---|---|---|
| Revenue (¥ million) | 619,863 | 609,091 | +1.8% |
| Gross profit (¥ million) | 100,455 | 94,133 | +6.7% |
| Gross margin | 16.2% | 15.5% | +0.8 pt |
| Operating profit (¥ million) | 10,082 | 5,638 | +78.8% |
| Operating margin | 1.63% | 0.93% | +0.70 pt |
| Ordinary profit (¥ million) | 9,740 | 4,839 | +101.3% |
| Profit before income taxes (¥ million) | 8,985 | 6,777 | +32.6% |
| Quarterly net profit (¥ million) | 3,500 | 3,376 | +3.7% |
| Profit attrib. to owners of parent (¥ million) | 1,411 | 738 | +91.2% |
| Comprehensive income (¥ million) | 4,974 | −1,265 | to profit |
| Basic EPS (¥) | 1.05 | 0.55 | +90.9% |
| Global retail volume (units) | 179,000 | ≈194,600 | −8% |
| Automotive segment revenue (¥ million) | 609,769 | 600,808 | +1.5% |
| Automotive segment profit (¥ million) | 9,578 | 4,956 | +93.3% |
| Financial services revenue (¥ million) | 15,147 | 13,129 | +15.4% |
| Financial services segment profit (¥ million) | 620 | 738 | −16.0% |
| Total assets (¥ million; vs Mar 31, 2026) | 2,313,475 | 2,418,145 | −4.3% |
| Cash and deposits (¥ million; vs Mar 31, 2026) | 307,033 | 438,891 | −30.0% |
| Interest-bearing debt (¥ billion; vs Mar 31, 2026) | 413.6 | 395.4 | +4.6% |
| Net assets (¥ million; vs Mar 31, 2026) | 961,643 | 963,318 | −0.2% |
| Equity ratio (vs Mar 31, 2026) | 39.6% | 38.0% | +1.6 pt |
JapanStockPulse provides informational content only and does not constitute investment advice. Figures are taken from the company's published earnings short report and may be subject to subsequent revision.