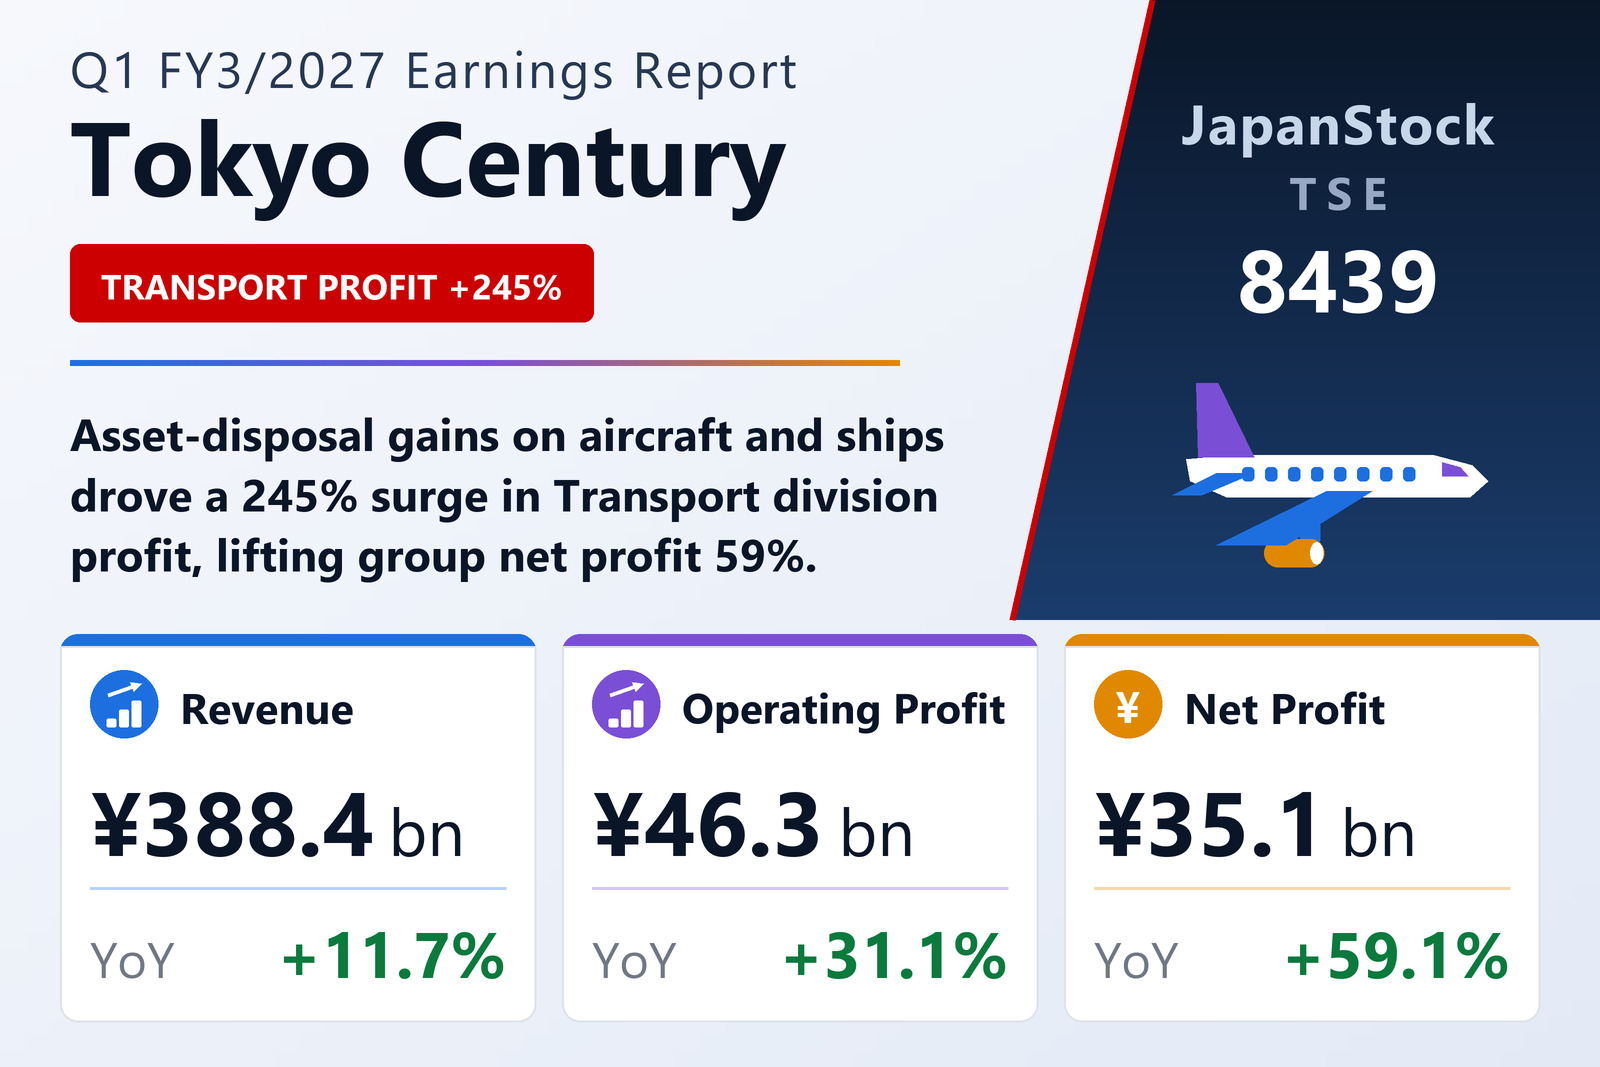
Tokyo Century Corporation (TSE: 8439) reported consolidated first-quarter results for the three months to June 30, 2026 under Japanese GAAP. Revenue rose 11.7% to ¥388,407 million, operating profit climbed 31.1% to ¥46,303 million, recurring profit advanced 36.9% to ¥51,057 million and profit attributable to owners of the parent leapt 59.1% to ¥35,129 million from ¥22,082 million. Earnings per share reached ¥71.85 against ¥45.25. Comprehensive income swung dramatically, to a ¥63,971 million gain from a ¥29,245 million loss a year earlier, as currency translation moved in the group's favour.
Gross profit up 19.5%, and the gains keep coming below the line
Gross profit expanded ¥15.1 billion, or 19.5%, to ¥92.3 billion, which the company attributes primarily to the International Business and Transport divisions. Selling, general and administrative expenses rose ¥4.1 billion (9.8%) to ¥46.0 billion, mostly on higher personnel and property costs in International Business. Non-operating income more than doubled, up ¥2.8 billion (141.4%) to a ¥4.8 billion profit, driven by higher equity-method earnings. Below recurring profit, extraordinary items contributed a ¥1.5 billion gain, largely a litigation settlement. Income taxes increased ¥2.1 billion (18.9%) to ¥13.4 billion and profit attributable to non-controlling interests rose ¥0.3 billion (6.7%) to ¥4.1 billion — neither enough to blunt the 59.1% rise at the bottom line.
Six new segments, and Transport steals the quarter
Following an organisational overhaul on April 1, 2026, Tokyo Century has replaced its five former reporting segments — Domestic Leasing, Auto Mobility, Specialty, International and Environmental Infrastructure — with six: two customer-facing front divisions (Domestic Business and International Business) and four product divisions (Social Infrastructure, Transport, Mobility and Corporate Investment). Prior-year figures are restated on the new basis. The standout is Transport, where segment profit more than tripled — up 245.4% to ¥12.2 billion on higher gains from aircraft disposals and vessel sales, with revenue up 20.5% to ¥61.5 billion and segment assets up 4.4% to ¥2,348.7 billion, by far the group's largest asset pool. International Business grew revenue fastest, up 35.9% to ¥64.3 billion, with profit up 37.4% to ¥5.0 billion on a large ITAD mandate at subsidiary CSI Leasing and solid North American leasing. Domestic Business remained the revenue anchor at ¥127.6 billion (+8.7%), with profit up 17.2% to ¥8.1 billion on a bigger pick-up of earnings from the NTT・TC Leasing joint venture. Social Infrastructure lifted profit 37.8% to ¥3.3 billion on real-estate disposal gains and overseas renewable-energy projects even as revenue slipped 2.5%. Mobility added 13.7% to ¥7.4 billion on higher used-car prices and inbound-driven rental-car demand. Only Corporate Investment fell, down 12.5% to ¥1.4 billion, because this year's capital gains ran below last year's.
| Segment | Revenue (¥ billion) | Revenue YoY | Segment profit (¥ billion) | Profit YoY | Segment assets (¥ billion) |
|---|---|---|---|---|---|
| Domestic Business | 127.6 | +8.7% | 8.1 | +17.2% | 1,290.6 |
| International Business | 64.3 | +35.9% | 5.0 | +37.4% | 955.4 |
| Social Infrastructure | 40.7 | -2.5% | 3.3 | +37.8% | 1,105.6 |
| Transport | 61.5 | +20.5% | 12.2 | +245.4% | 2,348.7 |
| Mobility | 90.7 | +6.3% | 7.4 | +13.7% | 571.2 |
| Corporate Investment | 2.7 | -3.3% | 1.4 | -12.5% | 91.9 |
| Other & adjustments | — | — | -2.2 | — | 92.5 |
| Consolidated | 388.4 | +11.7% | 35.1 | +59.1% | 6,455.9 |
A balance sheet that grows on both sides
Total assets rose ¥222.7 billion (3.1%) to ¥7,437.5 billion, with segment assets up ¥145.2 billion (2.3%) to ¥6,455.9 billion. Liabilities grew in step, up ¥183.4 billion (3.1%) to ¥6,145.7 billion, of which interest-bearing debt increased ¥228.4 billion (4.4%) to ¥5,370.9 billion — the funding engine of a leasing balance sheet. Net assets improved ¥39.2 billion (3.1%) to ¥1,291.8 billion, driven by a ¥13.5 billion rise in retained earnings and a ¥22.1 billion increase in the foreign-currency translation adjustment. That left the equity ratio 0.1 point higher at 15.6%, with shareholders' equity of ¥1,159.1 billion. The translation swing has a specific cause worth noting: the group's main overseas subsidiaries and affiliates close their books in December, and the rate used for their consolidation moved to ¥159.93 per US dollar (as of March 2026) from ¥156.54 (December 2025).
Guidance untouched, dividend up 12.5%
Tokyo Century made no revision to the consolidated forecast published on May 11, 2026: profit attributable to owners of the parent of ¥123,000 million, up 10.5%, with earnings per share of ¥251.66. The first quarter's ¥35.1 billion represents 28.6% of that target — comfortably ahead of a straight-line quarter, though the Transport division's disposal gains are by nature lumpy. The dividend forecast is likewise unchanged and notably higher: ¥90.00 per share for FY3/2027, split evenly between a ¥45.00 interim and a ¥45.00 year-end payment, against ¥80.00 paid for FY3/2026 (¥36.00 interim plus ¥44.00 year-end). The company applies special accounting treatments permitted for the preparation of quarterly consolidated statements; there were no changes in accounting policies, estimates or restatements.
| Metric | Q1 FY3/2027 | Q1 FY3/2026 | YoY |
|---|---|---|---|
| Revenue (¥ million) | 388,407 | 347,586 | +11.7% |
| Gross profit (¥ billion) | 92.3 | 77.2 | +19.5% |
| Operating profit (¥ million) | 46,303 | 35,312 | +31.1% |
| Recurring profit (¥ million) | 51,057 | 37,282 | +36.9% |
| Profit attributable to owners (¥ million) | 35,129 | 22,082 | +59.1% |
| Comprehensive income (¥ million) | 63,971 | -29,245 | turned positive |
| EPS (¥) | 71.85 | 45.25 | +58.8% |
| Total assets (¥ million) | 7,437,496 | 7,214,810 | +3.1% |
| Interest-bearing debt (¥ billion) | 5,370.9 | 5,142.5 | +4.4% |
| Net assets (¥ million) | 1,291,832 | 1,252,593 | +3.1% |
| Shareholders' equity (¥ million) | 1,159,114 | 1,120,503 | +3.4% |
| Equity ratio (%) | 15.6 | 15.5 | +0.1pt |
| Annual dividend per share (¥) | 90.00 | 80.00 | +12.5% |
| FY3/2027 guidance — profit attributable (¥ million) | 123,000 | — | +10.5% |
JapanStockPulse provides informational content only and does not constitute investment advice. Figures are taken from the company’s published earnings short report and may be subject to subsequent revision.