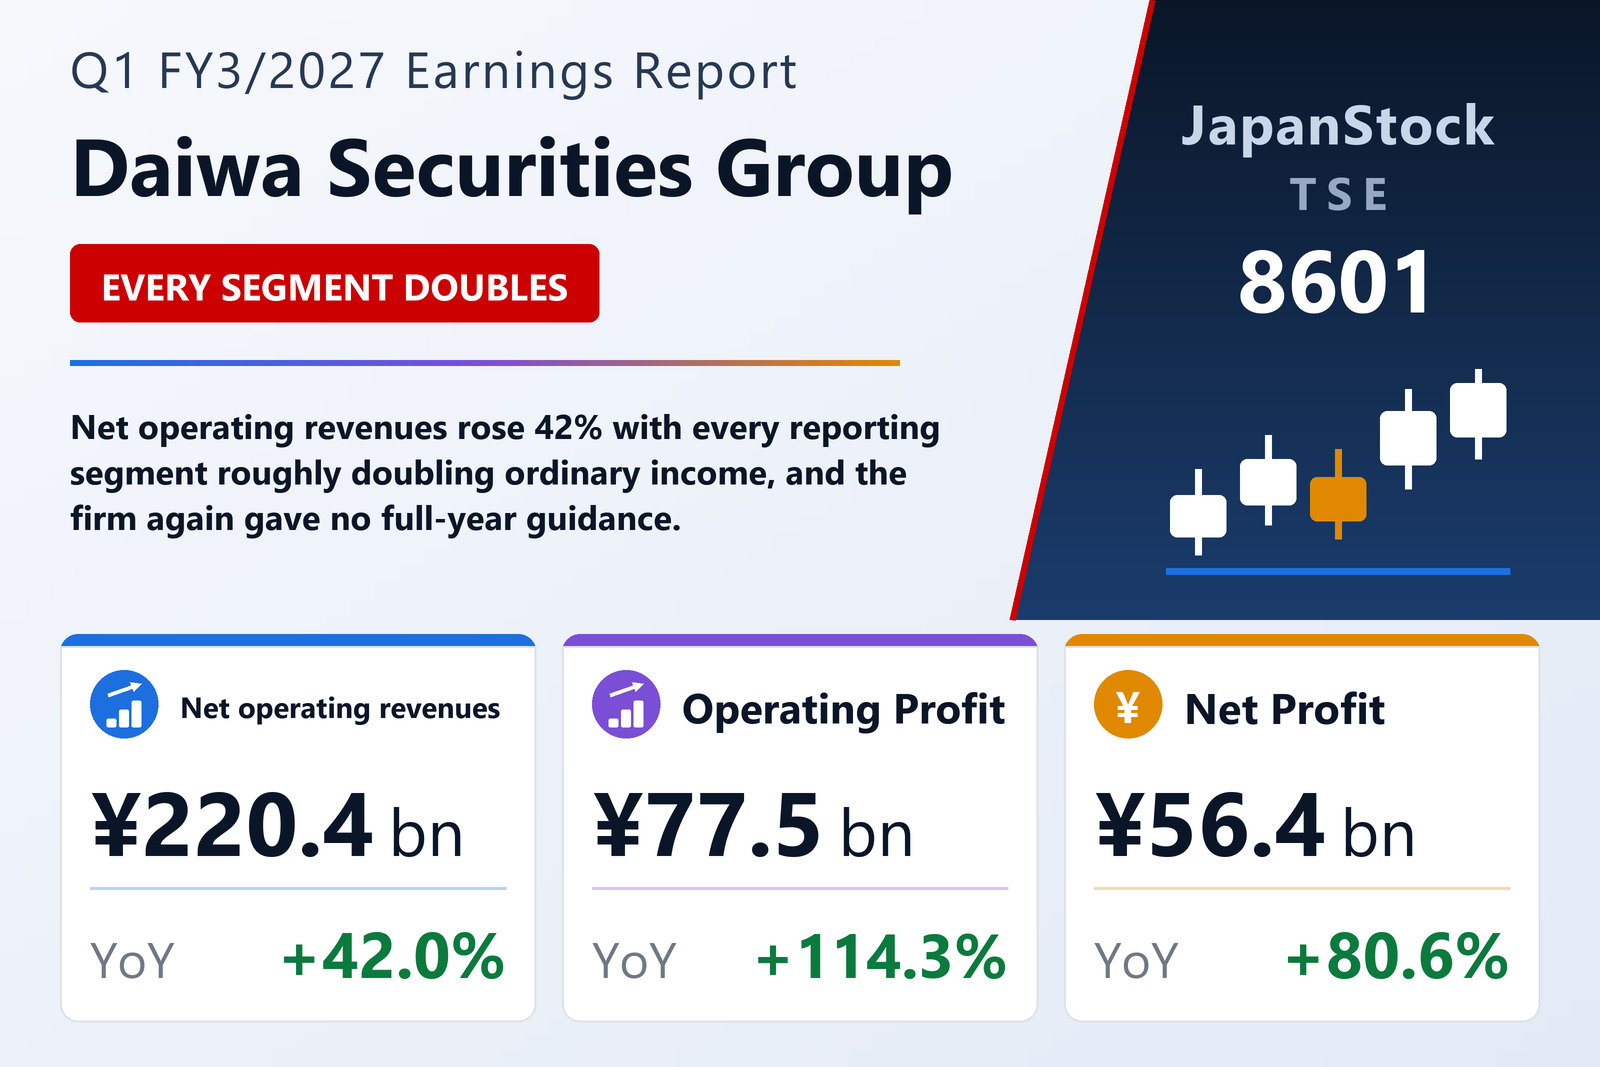
Daiwa Securities Group Inc. (TSE: 8601) reported consolidated results for the first quarter of the year to March 2027, covering April 1 to June 30, 2026, under Japanese GAAP. Operating revenues rose 33.1% to ¥434,364 million, net operating revenues rose 42.0% to ¥220,399 million, operating income more than doubled at +114.3% to ¥77,512 million, ordinary income rose 101.5% to ¥88,089 million, and profit attributable to owners of the parent rose 80.6% to ¥56,414 million. Comprehensive income more than doubled to ¥85,035 million, up 156.6%. Basic earnings per share were ¥40.68 against ¥22.20 a year earlier, and diluted earnings per share ¥40.06 against ¥21.94.
What net operating revenues means, and why the two growth rates differ
Securities firms report two top lines. Operating revenues are the gross figure, including interest and dividends earned on the large securities and financing books a brokerage carries. Net operating revenues subtract financial expenses — the interest a firm pays to fund those same positions — and are the number the industry treats as its meaningful revenue measure, because a securities house can inflate gross revenues simply by borrowing more to carry more inventory.
The gap between the two growth rates is itself informative. Gross operating revenues grew 33.1% while net operating revenues grew 42.0%, meaning revenue expanded faster than the cost of funding it. Daiwa attributes that to a genuine improvement in fee and trading income rather than balance-sheet expansion: net financial income rose 23.9% to about ¥24.5 billion on higher bond interest, but the bigger contributions came from customer activity.
Where the growth came from
Commissions received climbed 42.9% to about ¥143.4 billion. Within that, brokerage commissions jumped 65.3% to roughly ¥34.9 billion as equity trading volumes increased, and underwriting and secondary-distribution commissions surged 91.8% to about ¥17.0 billion, which the company credits to several large underwriting mandates. Net trading income rose 48.9% to around ¥33.2 billion, led by equities. Costs rose too, but far more slowly: selling, general and administrative expenses were up 20.0% at roughly ¥142.8 billion, with transaction-related costs up 22.9% to about ¥28.8 billion and personnel expenses up 23.1% to about ¥71.6 billion, the latter driven mainly by performance-linked bonuses.
Every reporting segment contributed
The Wealth Management division lifted net operating revenues 40.3% to ¥88,230 million and ordinary income 88.9% to ¥37,274 million, helped by broader product sales and sustained wrap-account income; the contract asset balance in wrap services reached a record ¥6.765 trillion. Deposits at Daiwa Next Bank, including negotiable certificates of deposit, rose 4.8% from the March year-end to ¥5.3085 trillion across 2.37 million accounts, up 3.9%.
Asset Management grew net operating revenues 45.1% to ¥40,928 million and ordinary income 105.5% to ¥30,362 million. Securities asset management contributed ¥21,271 million of net operating revenues, up 40.0%, with Daiwa Asset Management's assets under management reaching ¥50.4 trillion on net inflows and rising equity markets; real-estate asset management added ¥13,327 million, up 37.9%, on assets under management of ¥1.8106 trillion; and alternative asset management contributed ¥6,329 million, up 88.6%, with ordinary income of ¥4,815 million — more than fifteen times the year-earlier ¥318 million — on exit gains from portfolio investments.
Global Markets & Investment Banking was the sharpest mover, with net operating revenues up 53.6% to ¥76,512 million and ordinary income up 354.0% to ¥22,710 million. Global Markets alone grew net operating revenues 65.4% to ¥53,854 million and ordinary income 589.5% to ¥18,198 million as client flow rose in both equities and fixed income and position management worked in the firm's favour. Global Investment Banking added ¥22,658 million of net operating revenues, up 31.2%, and ¥3,273 million of ordinary income, up 262.4%, on multiple lead-manager mandates in equity and debt and a busy M&A calendar. The Other and adjustments line, which mainly covers Daiwa Institute of Research, produced ¥14,727 million of net operating revenues but an ordinary loss of ¥2,257 million, against ordinary income of ¥4,207 million a year earlier.
A balance sheet built on leverage
Total assets grew 4.7% from the March year-end to ¥39,867,264 million, driven by a ¥1.09 trillion increase in cash and deposits to ¥4.88 trillion and a ¥1.21 trillion increase in trading assets to ¥13.60 trillion. Net assets rose 1.5% to ¥2,077,378 million, shareholders' equity to ¥1,796,774 million from ¥1,763,569 million, and book value per share to ¥1,294.66 from ¥1,272.72. The equity ratio slipped to 4.5% from 4.6% — a level that looks alarming next to an industrial company but is normal for a securities group, whose assets are dominated by trading inventory, collateralised securities lending and bank deposits that are funded, by design, with matching liabilities rather than equity. Retained earnings rose 0.7% to ¥1.13 trillion after the quarter's profit was offset by ¥48.4 billion of dividend payments.
Shares outstanding were unchanged at 1,569,378,772. Treasury shares edged down to 181,602,635 from 183,731,624 at the March year-end, and the treasury-stock deduction on the balance sheet fell 1.2% to ¥147.8 billion — a small disposal, not a new buyback; the filing discloses no repurchase programme for the quarter. The weighted-average share count used for per-share figures was 1,386,824,170 against 1,407,108,448 a year earlier, so this quarter's earnings are spread across a smaller base than the comparative period.
No forecast, and a dividend deliberately left undetermined
Daiwa publishes no full-year earnings forecast. The company states plainly that the results of its principal securities-related business are heavily influenced by economic conditions and market environment, making a forecast impractical — so there is no guidance figure to compare this quarter against, and none should be inferred.
That flows directly into the dividend. Daiwa's policy is two payments a year, an interim and a year-end, at a consolidated payout ratio of at least 50%, and for the three years from FY3/2025 through FY3/2027 it has set a floor of ¥44.00 per share for the full-year dividend. The ¥44.00 shown in the FY3/2027 forecast row of the earnings release is that floor, entered for convenience; the interim and year-end lines are shown as dashes. Because there is no earnings forecast, the actual FY3/2027 dividend is undetermined and will be set from consolidated results under the payout policy. FY3/2026 paid ¥64.00 in total — ¥29.00 interim plus ¥35.00 year-end — so the ¥44.00 is a floor, not a declared cut.
ORIX Bank acquisition completed on results day
Daiwa disclosed as a material subsequent event that Daiwa Next Bank, its wholly owned banking subsidiary, has acquired 100% of ORIX Bank Corporation from ORIX Corporation for cash consideration of approximately ¥370 billion, subject to price adjustment under the share transfer agreement signed on April 27, 2026. The acquisition completed on August 3, 2026, the same day as this earnings release. Daiwa's stated rationale is that Daiwa Next Bank, built since 2011 on a low-cost, market-investment deposit model, has more deposits than it can deploy efficiently, while ORIX Bank brings real-estate lending and trust capabilities the group's clients increasingly ask for. Goodwill, acquisition-related costs and the fair value of assets and liabilities acquired have not yet been determined.
One procedural note: the quarterly consolidated financial statements attached to this release have not been reviewed by a certified public accountant or audit firm. Daiwa plans to disclose a reviewed version of the tanshin, with the review report attached, on August 6, 2026.
| Metric | Q1 FY3/2027 | Q1 FY3/2026 | YoY |
|---|---|---|---|
| Operating revenues (¥ million) | 434,364 | 326,400 | +33.1% |
| Net operating revenues (¥ million) | 220,399 | 155,252 | +42.0% |
| Operating income (¥ million) | 77,512 | 36,177 | +114.3% |
| Ordinary income (¥ million) | 88,089 | 43,716 | +101.5% |
| Profit attrib. to owners of parent (¥ million) | 56,414 | 31,237 | +80.6% |
| Comprehensive income (¥ million) | 85,035 | 33,144 | +156.6% |
| Basic EPS (¥) | 40.68 | 22.20 | +83.2% |
| Diluted EPS (¥) | 40.06 | 21.94 | +82.6% |
| Wealth Management — net op. revenues (¥ million) | 88,230 | 62,905 | +40.3% |
| Asset Management — net op. revenues (¥ million) | 40,928 | 28,213 | +45.1% |
| Global Markets & IB — net op. revenues (¥ million) | 76,512 | 49,827 | +53.6% |
| Total assets (¥ million) | 39,867,264 | 38,077,646 | +4.7% |
| Equity ratio (%) | 4.5 | 4.6 | -0.1pt |
| Book value per share (¥) | 1,294.66 | 1,272.72 | +1.7% |
JapanStockPulse provides informational content only and does not constitute investment advice. Balance-sheet comparatives are against March 31, 2026. Figures are taken from the company's published earnings short report, which has not yet been reviewed by an audit firm, and may be subject to subsequent revision.