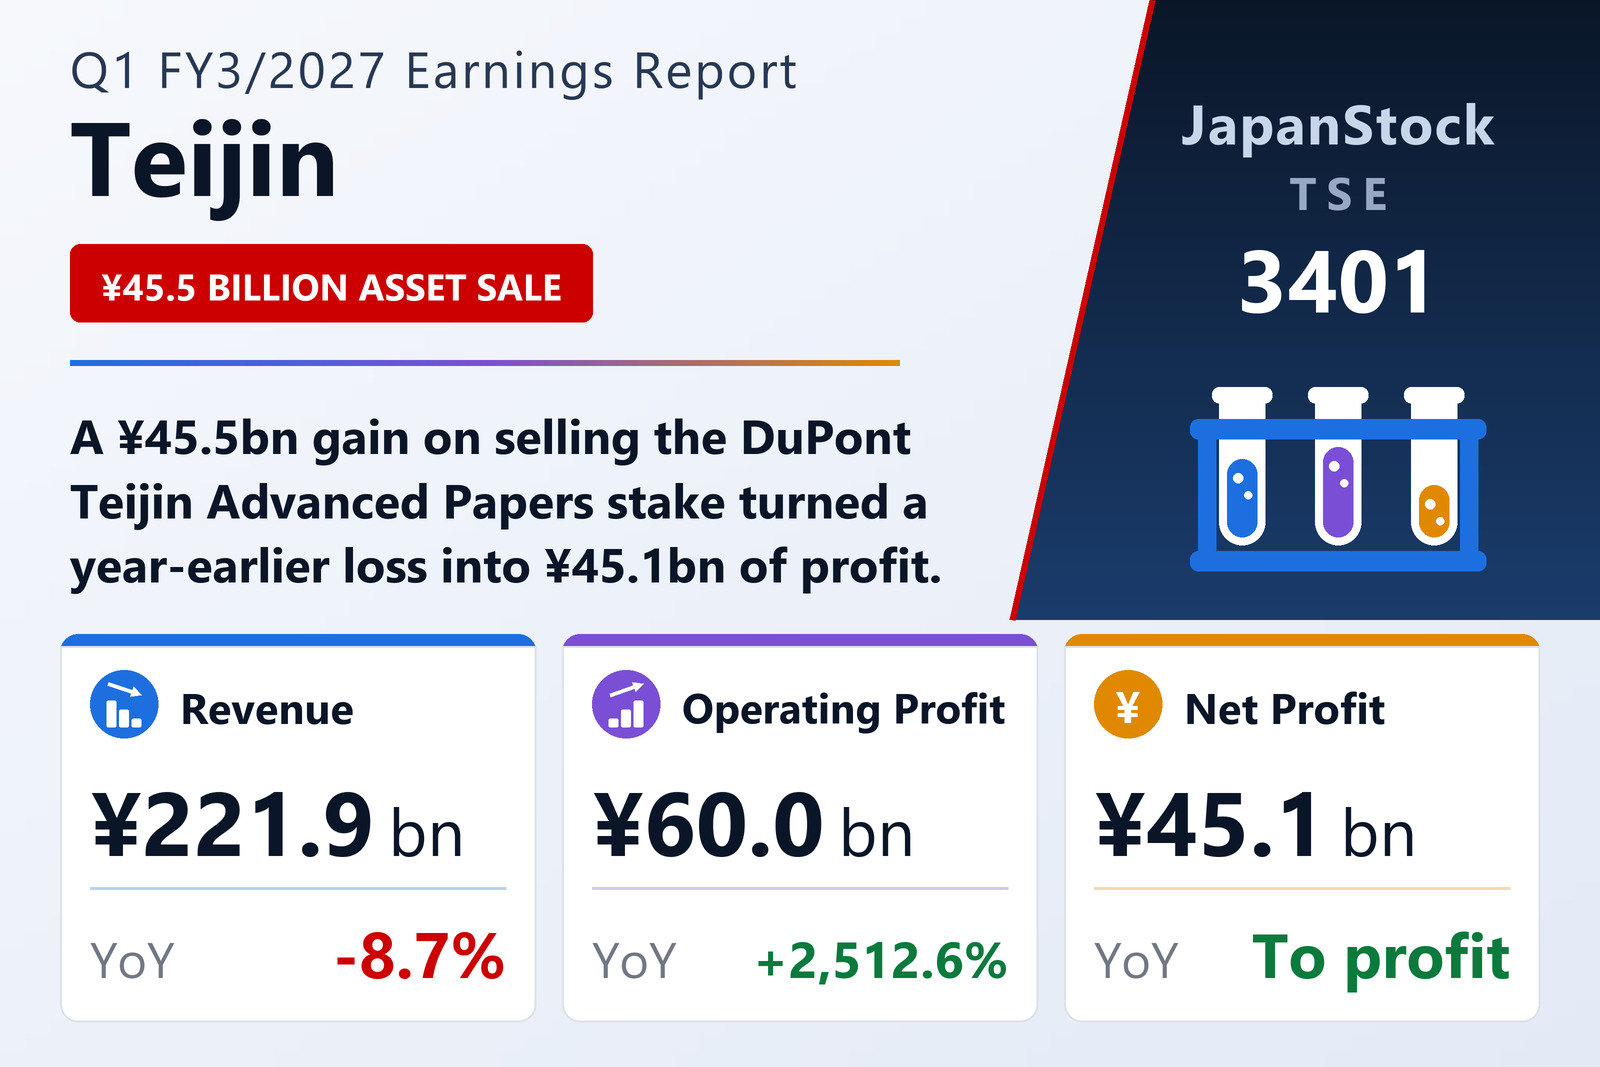
Teijin Limited (TSE: 3401), the Osaka-founded fibres, resins and healthcare group, reported consolidated first-quarter results for the three months to June 30, 2026 under IFRS. Revenue declined 8.7% to ¥221,943 million, but operating profit exploded to ¥59,959 million from ¥2,295 million and profit attributable to owners of the parent turned to a ¥45,106 million profit from a ¥740 million loss. Basic earnings per share were ¥233.81, against a loss of ¥3.84 a year earlier; diluted EPS was ¥233.73. Profit before tax reached ¥59,831 million, up from a token ¥62 million.
A single disposal rewrites the profit line
Almost the entire operating-profit leap sits in one line. Other income ballooned to ¥50,725 million from ¥2,056 million, of which ¥45,452 million was the gain on the sale of affiliate shares — Teijin completed the transfer of its holdings in DuPont Teijin Advanced Papers Ltd. and DuPont Teijin Advanced Papers (Asia) Limited to DuPont de Nemours, Inc. during the quarter. Those equity-method investments had been reclassified as assets held for sale at the March year-end; cash proceeds of ¥45,114 million show up in investing cash flow. A further ¥4,987 million gain on the sale of property, plant and equipment (against just ¥10 million a year ago) and a collapse in impairment losses to ¥29 million from ¥3,679 million added to the swing, partly offset by ¥2,149 million of special retirement payments tied to business-structure reform, up from ¥1,498 million. Strip all of that out and the picture is more sober but still improving.
Underlying earnings improved on their own
Teijin's preferred underlying metric — business profit, defined as operating profit plus equity-method income and excluding non-recurring items — rose 56.8% to ¥12,307 million from ¥7,847 million, lifting the business-profit margin to 5.5% from 3.2%. The mix mattered more than the top line: gross profit rose 4.9% to ¥58,621 million even as revenue fell, because cost of sales dropped 12.8% to ¥163,322 million, pushing the gross margin to 26.4% from 23.0%. Selling, general and administrative expenses fell 7.1% to ¥48,851 million. Below the operating line, finance costs more than halved to ¥1,777 million from ¥4,865 million while finance income was flat at ¥1,377 million; equity-method income slipped to ¥272 million from ¥1,267 million. Income tax expense of ¥14,796 million — against ¥631 million last year, reflecting the disposal gain — left quarterly profit of ¥45,035 million, of which ¥45,106 million was attributable to owners of the parent and a ¥72 million loss to non-controlling interests. Comprehensive income multiplied more than tenfold to ¥55,750 million from ¥5,438 million, helped by ¥4,992 million of foreign-currency translation gains and ¥3,169 million of cash-flow-hedge gains.
Segment scorecard under a brand-new four-way split
Teijin reorganised on April 1, 2026, replacing the old three-way Materials / Fibers & Products / Healthcare structure with four reporting segments: Apparel & Industries, Healthcare & Life Solutions, Electronics & Energy and Specialty Materials. Prior-year figures have been restated on the new basis. Three of the four grew business profit. Electronics & Energy — resins, battery materials and membranes — was the standout, with revenue up 23.5% to ¥45,271 million and business profit up 67.7% to ¥8,534 million. Apparel & Industries lifted revenue 11.7% to ¥91,705 million and business profit 16.7% to ¥4,770 million, while Healthcare & Life Solutions held business profit up 14.5% at ¥4,583 million on slightly lower revenue of ¥32,949 million. The drag came from Specialty Materials — aramid fibre, carbon fibre and composite moulding materials — where revenue fell 42.7% to ¥47,924 million, accounting for the whole of the group's revenue decline, although the segment's loss narrowed to ¥1,026 million from ¥1,765 million. The residual "Other" bucket, which houses regenerative medicine and implantable devices, widened its loss to ¥1,804 million from ¥338 million. Corporate and elimination adjustments were a smaller drag at ¥2,751 million versus ¥3,227 million.
| Segment | Revenue Q1 FY3/27 (¥ million) | Revenue Q1 FY3/26 (¥ million) | YoY | Business profit Q1 FY3/27 (¥ million) | Business profit Q1 FY3/26 (¥ million) |
|---|---|---|---|---|---|
| Apparel & Industries | 91,705 | 82,118 | +11.7% | 4,770 | 4,087 |
| Healthcare & Life Solutions | 32,949 | 33,832 | -2.6% | 4,583 | 4,001 |
| Electronics & Energy | 45,271 | 36,648 | +23.5% | 8,534 | 5,089 |
| Specialty Materials | 47,924 | 83,596 | -42.7% | -1,026 | -1,765 |
| Other | 4,093 | 6,924 | -40.9% | -1,804 | -338 |
| Corporate & eliminations | — | — | — | -2,751 | -3,227 |
| Consolidated | 221,943 | 243,117 | -8.7% | 12,307 | 7,847 |
Balance sheet: equity ratio vaults to 43.7%
The disposal reshaped the balance sheet as much as the income statement. Total assets grew to ¥950,183 million at June 30, 2026 from ¥920,115 million at March 31, with cash and equivalents up sharply to ¥141,027 million from ¥104,474 million. Equity attributable to owners of the parent rose to ¥415,141 million from ¥364,461 million as retained earnings climbed to ¥178,506 million from ¥138,509 million and other components of equity to ¥69,887 million from ¥58,634 million. Total equity reached ¥419,860 million. The result is a parent shareholders' equity ratio of 43.7%, up from 39.6% — a four-point improvement in a single quarter. Gearing eased too: bonds and borrowings fell to ¥300,380 million from ¥311,475 million (current ¥141,304 million plus non-current ¥159,076 million), so net interest-bearing debt dropped to roughly ¥159.4 billion from ¥207.0 billion. Deferred tax assets nearly halved to ¥6,878 million from ¥13,373 million, consistent with the quarter's tax charge, while inventories edged up to ¥214,582 million.
Free cash flow swings to ¥53.6 billion
Operating cash flow was steady at ¥17,254 million against ¥16,622 million, with a pre-tax profit of ¥59,831 million largely offset in the reconciliation by the non-cash disposal gain. The dramatic change was in investing, which turned to a ¥36,350 million inflow from an ¥18,550 million outflow: proceeds from the sale of investments of ¥45,155 million dwarfed capital expenditure, which itself was cut sharply to ¥11,494 million from ¥20,291 million. Free cash flow therefore swung to roughly ¥53.6 billion from a ¥1.9 billion outflow. Teijin used the money to deleverage: financing turned to a ¥17,812 million outflow from a ¥97,769 million inflow, as a ¥11,727 million net reduction in short-term borrowings replaced last year's ¥104,268 million net drawdown, alongside ¥4,823 million of dividends to parent shareholders and ¥1,198 million of lease repayments. With a ¥787 million positive translation effect, cash rose ¥36,578 million over the quarter.
Guidance revised, dividend held at ¥50
Teijin revised its full-year FY3/2027 consolidated forecast alongside the results. It now guides to revenue of ¥900,000 million (+3.1%), business profit of ¥30,000 million (+16.4%), operating profit of ¥70,000 million and profit attributable to owners of the parent of ¥45,000 million, for full-year EPS of ¥233.26. The last two carry no meaningful percentage comparison because of the prior year's depressed base. The arithmetic is striking: the first quarter alone delivered 100.2% of the full-year profit target and 85.7% of the operating-profit target, but only 41.0% of the business-profit target and 24.7% of guided revenue — a reminder that the headline profit is a one-time event while the operating grind runs for nine more months. The dividend forecast is unchanged at ¥50.00 per share for the year, split evenly between a ¥25.00 interim and a ¥25.00 year-end payment, matching FY3/2026.
Subsequent event: ¥257 million of treasury shares released to executives
On July 15, 2026, following a June 19 board resolution, Teijin disposed of treasury shares under its two executive share-compensation plans. The restricted-stock award covered 53,479 shares at ¥1,650 each, or ¥88,240,350, allocated to three directors, eleven group executive officers, one mission executive and four officers of overseas group companies. The performance-linked award covered 102,484 shares at the same ¥1,650, or ¥169,098,600. Together the two disposals released 155,963 shares worth ¥257,338,950. Treasury holdings stood at 5,038,843 shares at quarter-end against 197,953,707 shares issued, and the weighted-average share count for the quarter was 192,915,439. Assets held for sale at June 30 consisted mainly of inventories held by Teijin Pharma within Healthcare & Life Solutions.
| Metric | Q1 FY3/2027 | Q1 FY3/2026 | YoY |
|---|---|---|---|
| Revenue (¥ million) | 221,943 | 243,117 | -8.7% |
| Gross profit (¥ million) | 58,621 | 55,890 | +4.9% |
| Business profit (¥ million) | 12,307 | 7,847 | +56.8% |
| Operating profit (¥ million) | 59,959 | 2,295 | +2,512.6% |
| Gain on sale of affiliate shares (¥ million) | 45,452 | 605 | n.m. |
| Profit before tax (¥ million) | 59,831 | 62 | n.m. |
| Profit attributable to owners (¥ million) | 45,106 | -740 | to profit |
| Comprehensive income (¥ million) | 55,750 | 5,438 | +925.2% |
| Basic EPS (¥) | 233.81 | -3.84 | to profit |
| Operating cash flow (¥ million) | 17,254 | 16,622 | +3.8% |
| Investing cash flow (¥ million) | 36,350 | -18,550 | to inflow |
| Total assets (¥ million) | 950,183 | 920,115 | +3.3% |
| Equity attributable to owners (¥ million) | 415,141 | 364,461 | +13.9% |
| Parent equity ratio (%) | 43.7 | 39.6 | +4.1pt |
| Cash and equivalents (¥ million) | 141,027 | 104,474 | +35.0% |
| FY3/2027 guidance — revenue (¥ million) | 900,000 | — | +3.1% |
| FY3/2027 guidance — business profit (¥ million) | 30,000 | — | +16.4% |
| Annual dividend forecast (¥) | 50.00 | 50.00 | unchanged |
JapanStockPulse provides informational content only and does not constitute investment advice. Figures are taken from the company's published earnings short report and may be subject to subsequent revision.