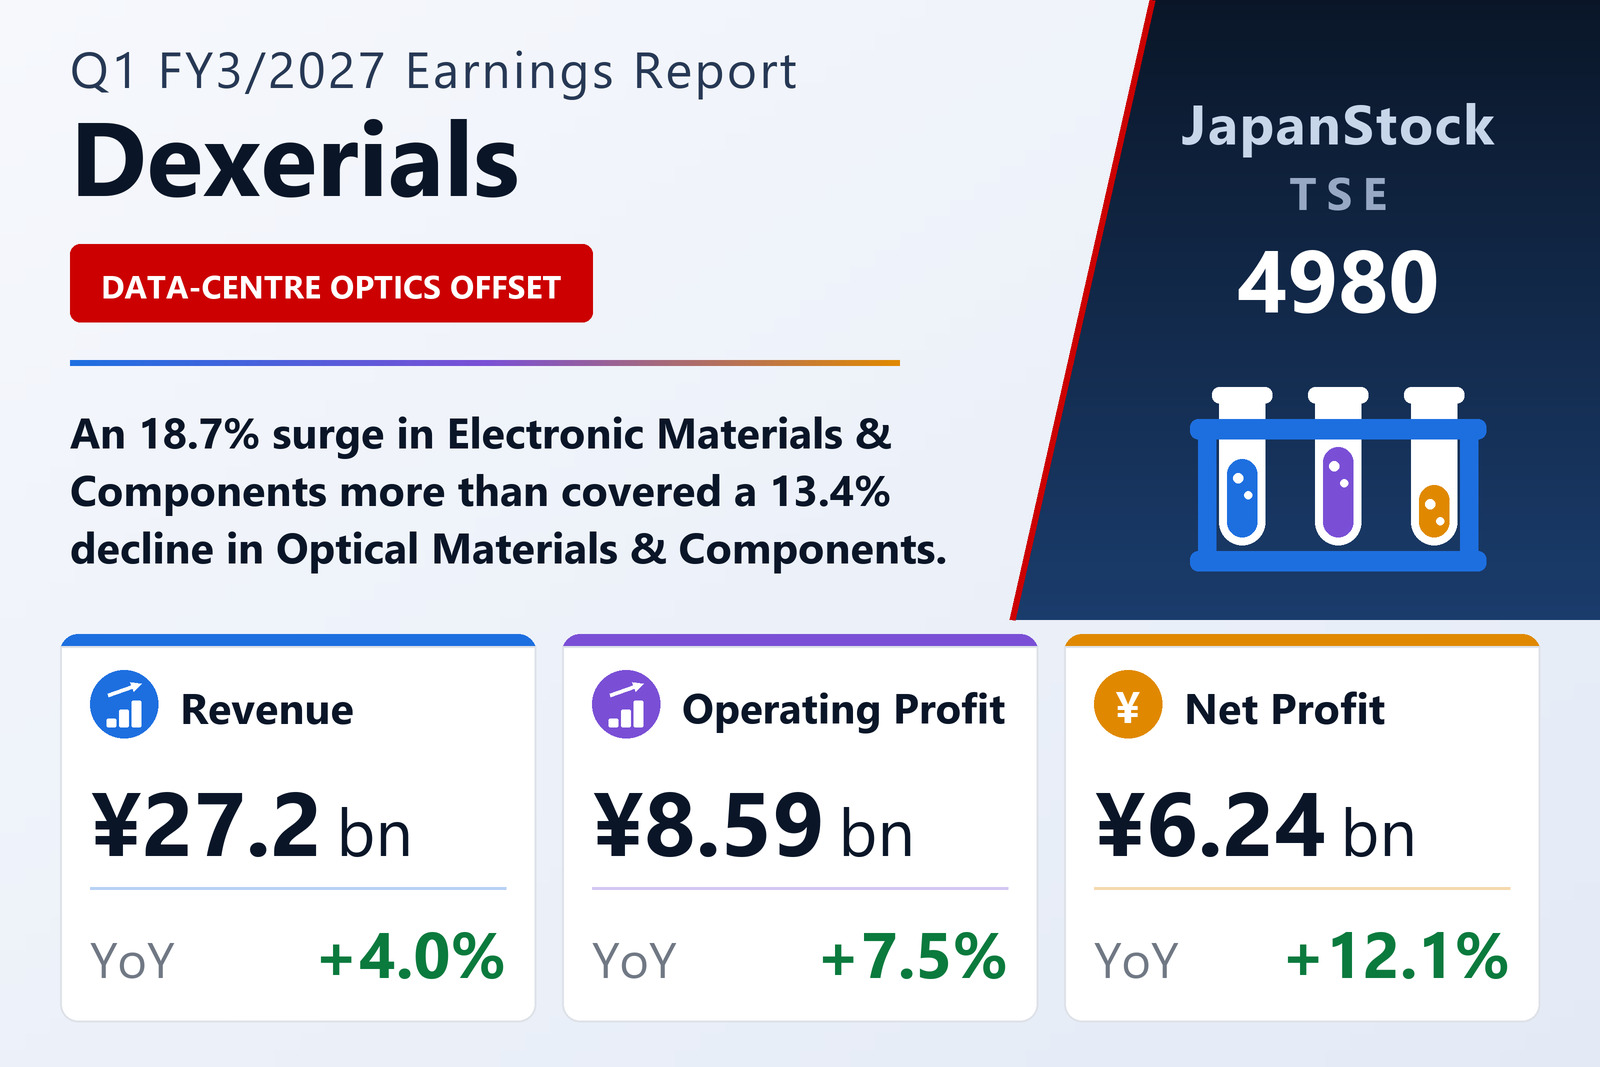
Dexerials Corporation (TSE: 4980), the Tochigi-based specialty materials maker spun out of Sony's chemical devices business, reported consolidated first-quarter results for the three months to June 30, 2026 under IFRS. Revenue rose 4.0% to ¥27,182 million, operating profit climbed 7.5% to ¥8,588 million, profit before tax advanced 12.9% to ¥8,705 million, and profit attributable to owners of the parent rose 12.1% to ¥6,241 million. Basic earnings per share were ¥37.25 against ¥33.14 a year earlier, with diluted EPS at ¥35.89 against ¥31.70.
A tale of two segments
The quarter was a clean handoff between Dexerials' two reporting segments. Electronic Materials & Components lifted revenue 18.7% to ¥17,080 million and business profit 21.7% to ¥5,561 million, taking its segment margin to 32.6% from 31.8%. Two drivers did the work: optical semiconductors, where demand for products used in data-centre optical transceivers expanded far enough that the company brought a new production line online at its plant in Tome, Miyagi Prefecture; and shaped anisotropic conductive film (ACF) for high-end smartphone camera modules, which benefited from higher build volumes at the models it is designed into. The division now supplies roughly 62% of group revenue, up from 55% a year ago.
Optical Materials & Components moved the other way, with revenue down 13.4% to ¥10,329 million and business profit down 18.5% to ¥2,713 million — a margin of 26.3% against 27.9%. The weakness was concentrated in anti-reflection film (ARF). Notebook PC display applications faced a payback effect after last year's first-half replacement wave in end devices, while automotive ARF was hit by intensifying competition in China's vehicle market, which cut customer order volumes. Precision bonding resin was the offset: it tracked higher high-end smartphone production and held up well through the quarter.
| Segment | Q1 FY3/27 revenue (¥m) | Q1 FY3/26 revenue (¥m) | YoY | Q1 FY3/27 business profit (¥m) | YoY |
|---|---|---|---|---|---|
| Optical Materials & Components | 10,329 | 11,933 | -13.4% | 2,713 | -18.5% |
| Electronic Materials & Components | 17,080 | 14,390 | +18.7% | 5,561 | +21.7% |
| Adjustments / eliminations | -226 | -183 | — | — | — |
| Consolidated total | 27,182 | 26,140 | +4.0% | 8,275 | +4.8% |
Mix, not volume, drove the gross margin
The most striking line in the income statement is cost of sales: it fell 2.2% to ¥12,093 million even as revenue rose 4.0%. That pushed gross profit up 9.6% to ¥15,089 million and the gross margin to 55.5% from 52.7%, reflecting the shift toward higher-value electronic materials and a yen that traded weaker year on year. Selling, general and administrative expenses grew far faster than the top line, up 16.0% to ¥6,814 million, which absorbed most of the gross-margin gain. The net result at the company's preferred operating metric — business profit, defined as revenue less cost of sales and SG&A — was a 4.8% rise to ¥8,275 million, a margin of 30.4% against 30.2%. EBITDA, which adds back depreciation charged to cost of sales and SG&A, rose 5.6% to ¥10,212 million for a 37.6% margin.
Everything below the operating line went the right way
Non-operating items are what turned a 4.8% business-profit gain into a 12.9% rise in pre-tax profit. Other income jumped to ¥605 million from ¥131 million, more than covering an increase in other expenses to ¥292 million from ¥46 million, and together those lines carried operating profit to ¥8,588 million, up 7.5%. Below that, equity-method investment results swung to a ¥184 million gain from a ¥114 million loss — a ¥298 million improvement — while finance costs nearly halved to ¥91 million from ¥169 million and finance income edged up to ¥23 million. Profit before tax therefore reached ¥8,705 million. The income tax charge rose to ¥2,463 million from ¥2,144 million, an effective rate of 28.3% against 27.8%, leaving quarterly profit at ¥6,241 million, all of it attributable to owners of the parent. Comprehensive income rose faster still, up 17.5% to ¥6,527 million, helped by ¥211 million of other comprehensive income from equity-method investees and a ¥154 million positive currency-translation adjustment.
The balance sheet shows where the capital is going
Total assets expanded by ¥11,986 million to ¥177,090 million from ¥165,104 million at March 31, 2026, and almost the entire increase sits in one line: property, plant and equipment rose ¥10,420 million to ¥87,278 million, consistent with the new optical-semiconductor capacity at Tome. Other current assets also swelled to ¥4,127 million from ¥984 million. Working capital moved the other way, with cash and equivalents easing to ¥15,189 million from ¥16,655 million and trade and other receivables to ¥20,490 million from ¥21,171 million, while inventories edged up to ¥10,964 million.
Funding that build shows on the liability side. Total liabilities increased ¥9,919 million to ¥65,660 million: other financial liabilities nearly doubled to ¥22,158 million from ¥12,011 million and non-current interest-bearing debt rose to ¥16,543 million from ¥13,330 million, partly offset by income taxes payable falling to ¥1,672 million from ¥3,879 million and employee benefits to ¥2,798 million from ¥4,473 million. Total equity rose a comparatively modest ¥2,066 million to ¥111,430 million, with retained earnings at ¥79,051 million after the year-end dividend payment. The arithmetic of a faster-growing balance sheet financed with debt is visible in the ratios: the parent-owner equity ratio fell to 62.9% from 66.2%, even as book value per share improved to ¥665.12 from ¥652.87.
No quarterly cash-flow statement — but depreciation tells the story
Dexerials does not prepare a condensed consolidated statement of cash flows for the first quarter, so investors get one disclosed proxy instead: depreciation and amortisation of ¥2,061 million, up 15.7% from ¥1,782 million. That is a materially faster growth rate than revenue and confirms that the capacity investment programme is now flowing through the P&L. With EBITDA of ¥10,212 million against business profit of ¥8,275 million, roughly ¥1,937 million of depreciation was charged within cost of sales and SG&A during the quarter.
Guidance untouched; dividend forecast up 10%
Management reaffirmed the full-year FY3/2027 outlook issued with the May 13, 2026 annual results, with no revision to any line: revenue of ¥123,000 million (+8.1%), business profit of ¥40,000 million (+1.6%), operating profit of ¥38,500 million (+1.1%), pre-tax profit of ¥38,500 million (+0.3%) and profit attributable to owners of the parent of ¥27,500 million (-1.8%), with EPS of ¥163.45. The first quarter delivered 22.1% of the revenue target and 22.7% of the full-year profit target, a slightly better-than-linear start given that the plan already implies flat-to-lower profit on materially higher sales.
The dividend forecast is likewise unrevised at ¥64.00 per share for FY3/2027 — ¥32.00 at the interim and ¥32.00 at the year-end — against ¥58.00 paid for FY3/2026, a 10.3% increase and a payout ratio of roughly 39% on guided EPS. There is no first-quarter dividend. On the share count, 174,741,400 shares remain issued and treasury holdings edged down to 7,208,459 shares from 7,231,259, reflecting restricted-stock awards and shares held through the company's J-ESOP and BBT-RS benefit trusts; the average share count for the quarter was 167,526,055. No share buyback was announced, and the filing discloses no going-concern issues, no change in the scope of consolidation, no accounting-policy changes and no material subsequent events. PwC Japan performed a voluntary interim review of the condensed financial statements and issued an unmodified conclusion.
| Metric | Q1 FY3/2027 | Q1 FY3/2026 | YoY |
|---|---|---|---|
| Revenue (¥m) | 27,182 | 26,140 | +4.0% |
| Gross profit (¥m) | 15,089 | 13,772 | +9.6% |
| Business profit (¥m) | 8,275 | 7,899 | +4.8% |
| EBITDA (¥m) | 10,212 | 9,667 | +5.6% |
| Operating profit (¥m) | 8,588 | 7,985 | +7.5% |
| Profit before tax (¥m) | 8,705 | 7,709 | +12.9% |
| Profit attributable to owners of parent (¥m) | 6,241 | 5,565 | +12.1% |
| Comprehensive income (¥m) | 6,527 | 5,555 | +17.5% |
| Basic EPS (¥) | 37.25 | 33.14 | +12.4% |
| Diluted EPS (¥) | 35.89 | 31.70 | +13.2% |
| Depreciation & amortisation (¥m) | 2,061 | 1,782 | +15.7% |
| Total assets (¥m) | 177,090 | 165,104 | +7.3% |
| Total equity (¥m) | 111,430 | 109,363 | +1.9% |
| Parent-owner equity ratio (%) | 62.9 | 66.2 | -3.3pt |
| Book value per share (¥) | 665.12 | 652.87 | +1.9% |
| FY3/2027 guidance — revenue (¥m) | 123,000 | — | +8.1% |
| FY3/2027 guidance — profit attributable (¥m) | 27,500 | — | -1.8% |
| FY3/2027 dividend forecast (¥/share) | 64.00 | 58.00 | +10.3% |
JapanStockPulse provides informational content only and does not constitute investment advice. Figures are taken from the company's published earnings short report and may be subject to subsequent revision.