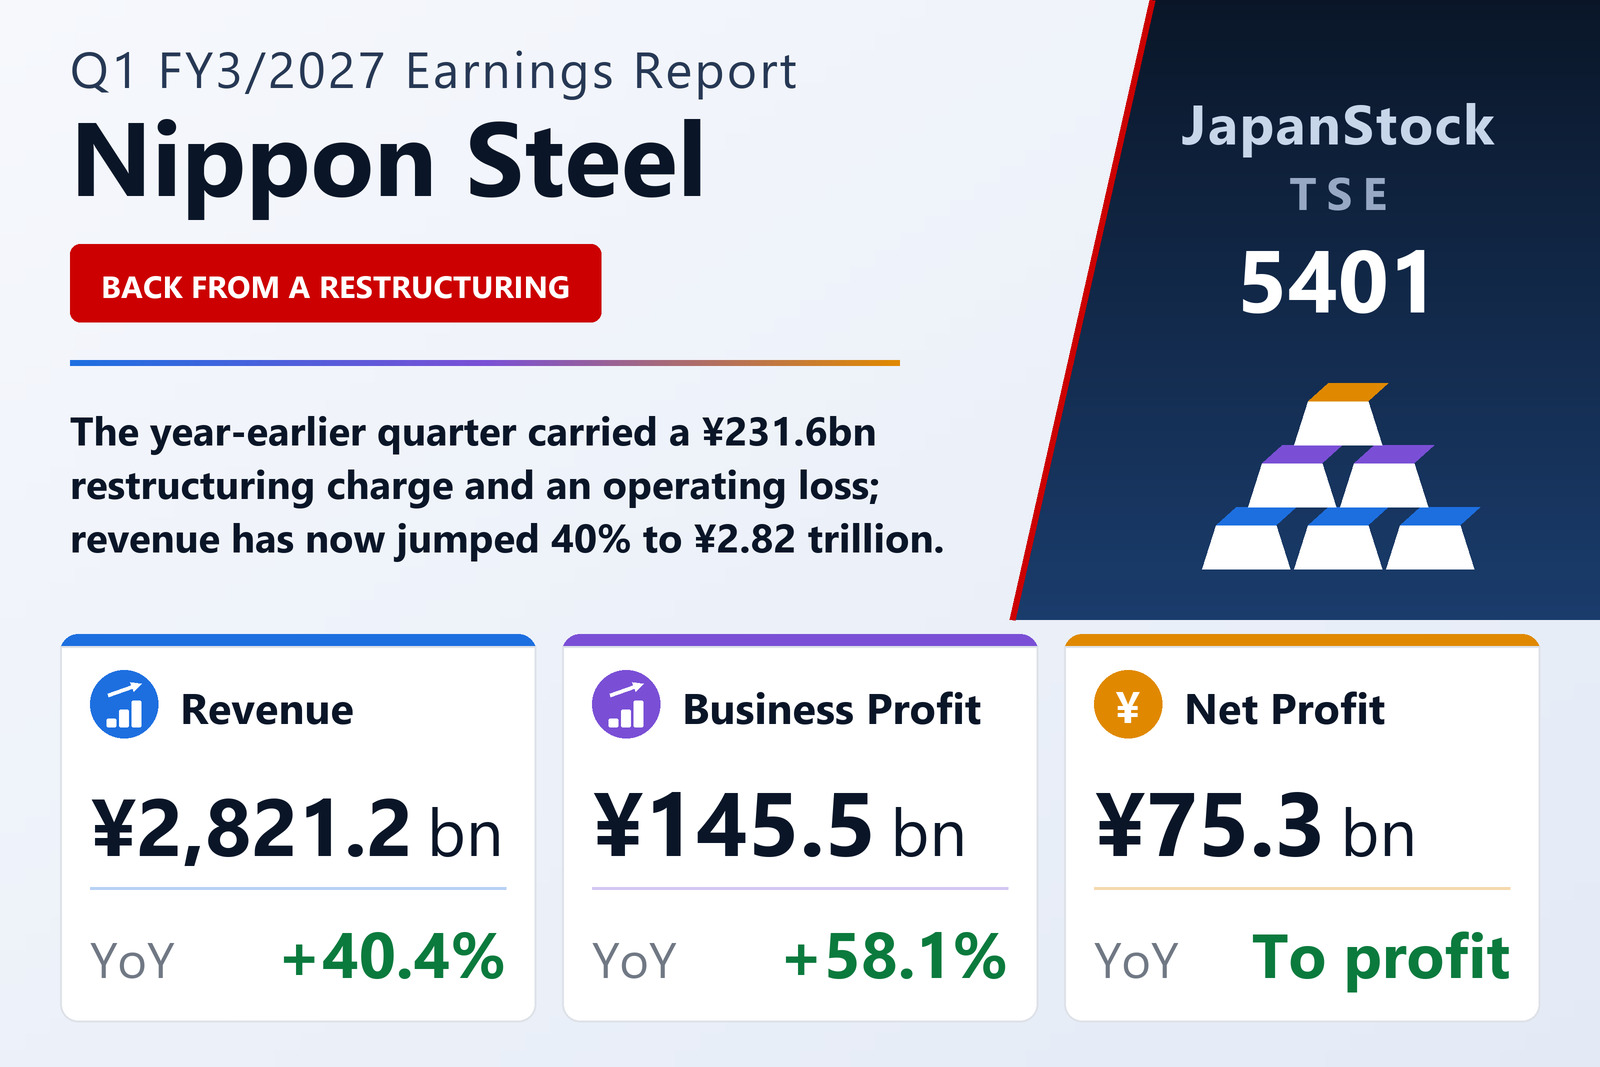
Nippon Steel Corporation (TSE: 5401), Japan's largest steel producer and one of the world's biggest by crude steel output, reported consolidated first-quarter results for the three months to June 30, 2026 under IFRS. Revenue rose 40.4% to ¥2,821,196 million, business profit — the company's headline measure of underlying operating performance — climbed 58.1% to ¥145,511 million, and profit attributable to owners of the parent came in at ¥75,299 million, against a loss of ¥195,833 million a year earlier. Basic earnings per share were ¥14.40 versus a loss of ¥37.47, with diluted EPS of ¥12.73.
A clean quarter after last year's restructuring charge
The most striking line in the statement is the one that has disappeared. In the June 2025 quarter Nippon Steel booked a business restructuring loss of ¥231,583 million, which turned a positive ¥92,023 million of business profit into a ¥139,559 million operating loss and drove the group to a ¥190,719 million bottom-line deficit. This year that line is blank: business profit and operating profit are identical at ¥145,511 million, so the entire operating result flows straight through to the pre-tax line. Profit before tax was ¥113,899 million against a ¥145,193 million loss, and profit for the period was ¥84,288 million against a ¥190,719 million loss, of which ¥8,988 million went to non-controlling interests.
Below the reported swing, the underlying business also improved. Gross profit rose 30.2% to ¥388,904 million from ¥298,723 million, although cost of sales grew faster than revenue and the gross margin therefore narrowed to 13.8% from 14.9%. Selling, general and administrative expenses rose to ¥284,489 million from ¥206,902 million in line with the enlarged consolidation base. Two smaller lines did much of the remaining work: other income more than doubled to ¥40,742 million from ¥18,471 million, while other expenses fell to ¥18,770 million from ¥45,688 million — together a ¥49.2 billion swing. Equity-method investment income was the one soft spot, easing to ¥19,124 million from ¥27,420 million. The net effect lifted the business-profit margin to 5.2% from 4.6%.
Steelmaking supplies almost all of the growth
Nippon Steel reports four segments, and the picture is dominated by one. Steelmaking revenue including intersegment sales rose 43.3% to ¥2,612,928 million and its segment business profit rose 69.2% to ¥144,269 million — that single division accounts for 86% of the group's segment-level profit and its margin improved to 5.5% from 4.7%. Chemicals & Materials produced the sharpest proportional gain, with profit up 189.4% to ¥9,216 million on a 17.3% revenue increase, the strongest recovery of any unit. System Solutions grew profit 9.7% to ¥9,589 million on 13.2% higher revenue. Engineering was the only division to move backwards, with revenue down 6.3% and profit down 22.9% to ¥4,202 million.
Corporate adjustments were a larger drag than a year earlier, at negative ¥21,767 million versus negative ¥10,600 million. Within that figure, equity-method income from Nippon Steel Kowa Real Estate collapsed to ¥21 million from ¥3,006 million, with the remaining negative ¥21,788 million representing intersegment eliminations. Segment interest-bearing debt shows where the balance sheet is levered: the Steelmaking division alone carried ¥5,485,415 million of the group's ¥5,515,740 million total, up from ¥5,139,779 million at the March year-end.
| Segment | Revenue Q1 FY3/27 (¥ billion) | Revenue Q1 FY3/26 (¥ billion) | YoY | Business profit Q1 FY3/27 (¥ billion) | Business profit Q1 FY3/26 (¥ billion) | YoY |
|---|---|---|---|---|---|---|
| Steelmaking | 2,612.9 | 1,823.1 | +43.3% | 144.3 | 85.2 | +69.2% |
| System Solutions | 93.9 | 82.9 | +13.2% | 9.6 | 8.7 | +9.7% |
| Chemicals & Materials | 73.9 | 63.0 | +17.3% | 9.2 | 3.2 | +189.4% |
| Engineering | 83.4 | 89.0 | -6.3% | 4.2 | 5.5 | -22.9% |
| Segment total | 2,864.0 | 2,058.0 | +39.2% | 167.3 | 102.6 | +63.0% |
| Adjustments & eliminations | -42.9 | -49.3 | — | -21.8 | -10.6 | — |
| Consolidated | 2,821.2 | 2,008.7 | +40.4% | 145.5 | 92.0 | +58.1% |
Depreciation and finance costs are the price of scale
Two cost lines expanded far faster than revenue, and both point to the enlarged asset base the group is now carrying. Depreciation and amortisation jumped 73.2% to ¥167,290 million from ¥96,593 million — a ¥70.7 billion increase that is roughly 2.5% of quarterly revenue and reflects a full three months of consolidation for the overseas steel operations that joined the group part-way through the prior fiscal year. Finance costs more than tripled, to ¥39,645 million from ¥11,952 million, against finance income of ¥8,033 million versus ¥6,318 million, leaving a net financial expense of ¥31,612 million compared with ¥5,634 million. That ¥26.0 billion deterioration absorbed almost half of the ¥53.5 billion improvement in business profit. Income tax expense was ¥29,611 million, down from ¥45,525 million, an effective rate of about 26% on the pre-tax profit.
Nippon Steel does not prepare a cash flow statement for the first quarter, so the depreciation disclosure is the only cash-proxy figure available. It is worth noting that the tanshin itself carries no management discussion: the company directs readers to the separate supplementary presentation released to TDnet on the same day rather than describing the drivers in the short report.
Balance sheet passes ¥15 trillion
Total assets grew to ¥15,176,086 million at June 30, 2026 from ¥14,660,583 million three months earlier, an increase of ¥515.5 billion. Most of the growth is in working capital and fixed assets: inventories rose to ¥2,915,392 million from ¥2,776,012 million, trade and other receivables to ¥1,830,920 million from ¥1,768,226 million, and property, plant and equipment to ¥6,070,749 million from ¥5,899,583 million. Cash and equivalents improved to ¥489,726 million from ¥461,262 million. Goodwill was broadly stable at ¥262,975 million and intangibles at ¥842,431 million, the small increases consistent with currency translation rather than new acquisitions.
The funding side is where the strain shows. Total liabilities rose to ¥9,054,760 million from ¥8,636,023 million, with interest-bearing debt — bonds, borrowings and lease liabilities across current and non-current — climbing to ¥5,515,740 million from ¥5,174,253 million, an increase of ¥341.5 billion in three months. Equity attributable to owners of the parent rose more modestly, to ¥5,636,142 million from ¥5,530,448 million, helped by ¥170,919 million of comprehensive income of which a ¥57,406 million currency-translation gain on foreign operations was the largest single component. Because assets grew faster than equity, the parent-owner equity ratio slipped to 37.1% from 37.7%. Dividends of ¥62,814 million were paid during the quarter, and the consolidation scope changed by two additions and twelve removals.
Full-year guidance revised to ¥630 billion of business profit
The company revised its previously published forecast alongside these results. For the twelve months to March 2027 it now projects revenue of ¥11,200,000 million (+11.3%), business profit of ¥630,000 million (+22.5%), profit attributable to owners of ¥290,000 million and basic EPS of ¥55.00 — the profit line carries no percentage because the prior year was a loss. The implied comparison base is roughly ¥10.06 trillion of revenue and ¥514 billion of business profit in FY3/2026. For the first half the company guides to revenue of ¥5,600,000 million (+20.8%), business profit of ¥260,000 million (+14.3%), attributable profit of ¥120,000 million and EPS of ¥23.00.
Measured against those targets, the opening quarter is running slightly ahead on the top line and slightly behind on profit: revenue of ¥2,821,196 million is 25.2% of the full-year figure, business profit is 23.1%, and attributable profit is 26.0%. Against the half-year plan, business profit is 56.0% complete after one quarter. As always with a heavy-industry first quarter, seasonality and steel-price timing mean the run-rate is not a straight-line indicator.
Dividend held at ¥24, but mind the five-for-one split
Nippon Steel executed a five-for-one common stock split effective October 1, 2025, which makes the dividend table read awkwardly. For FY3/2026 the interim dividend of ¥60.00 was struck on a September 30, 2025 record date and is therefore a pre-split figure, while the ¥12.00 year-end dividend used a March 31, 2026 record date and is post-split. The two cannot simply be added, which is why the annual total is shown as a dash; on a split-adjusted basis the FY3/2026 payout was ¥24.00 per share. For FY3/2027 the company forecasts an interim of ¥12.00 and a year-end of ¥12.00 for an annual total of ¥24.00 per share, unchanged from its previous announcement. Prior-year per-share earnings and the average share count have likewise been restated as if the split had occurred at the start of that year. Shares issued stood at 5,373,633,760 with 147,347,113 held in treasury, and the average share count for the quarter was 5,226,290,895.
| Metric | Q1 FY3/2027 | Q1 FY3/2026 | YoY |
|---|---|---|---|
| Revenue (¥ billion) | 2,821.20 | 2,008.75 | +40.4% |
| Gross profit (¥ billion) | 388.90 | 298.72 | +30.2% |
| Business profit (¥ billion) | 145.51 | 92.02 | +58.1% |
| Operating profit / (loss) (¥ billion) | 145.51 | -139.56 | to profit |
| Business restructuring loss (¥ billion) | — | -231.58 | absent |
| Profit / (loss) before tax (¥ billion) | 113.90 | -145.19 | to profit |
| Profit / (loss) attributable to owners (¥ billion) | 75.30 | -195.83 | to profit |
| Comprehensive income attrib. to owners (¥ billion) | 170.92 | -279.29 | to profit |
| Basic EPS (¥) | 14.40 | -37.47 | to profit |
| Diluted EPS (¥) | 12.73 | -37.47 | to profit |
| Depreciation & amortisation (¥ billion) | 167.29 | 96.59 | +73.2% |
| Finance costs (¥ billion) | 39.65 | 11.95 | +231.7% |
| Total assets (¥ billion) | 15,176.09 | 14,660.58 | +3.5% |
| Equity attributable to owners (¥ billion) | 5,636.14 | 5,530.45 | +1.9% |
| Interest-bearing debt (¥ billion) | 5,515.74 | 5,174.25 | +6.6% |
| Parent-owner equity ratio (%) | 37.1 | 37.7 | -0.6 pt |
| FY3/2027 guidance — revenue (¥ billion) | 11,200.00 | — | +11.3% |
| FY3/2027 guidance — business profit (¥ billion) | 630.00 | — | +22.5% |
| FY3/2027 guidance — profit attributable (¥ billion) | 290.00 | — | — |
| FY3/2027 dividend forecast (¥ per share) | 24.00 | 24.00 | unchanged |
JapanStockPulse provides informational content only and does not constitute investment advice. Figures are taken from the company's published earnings short report and may be subject to subsequent revision.