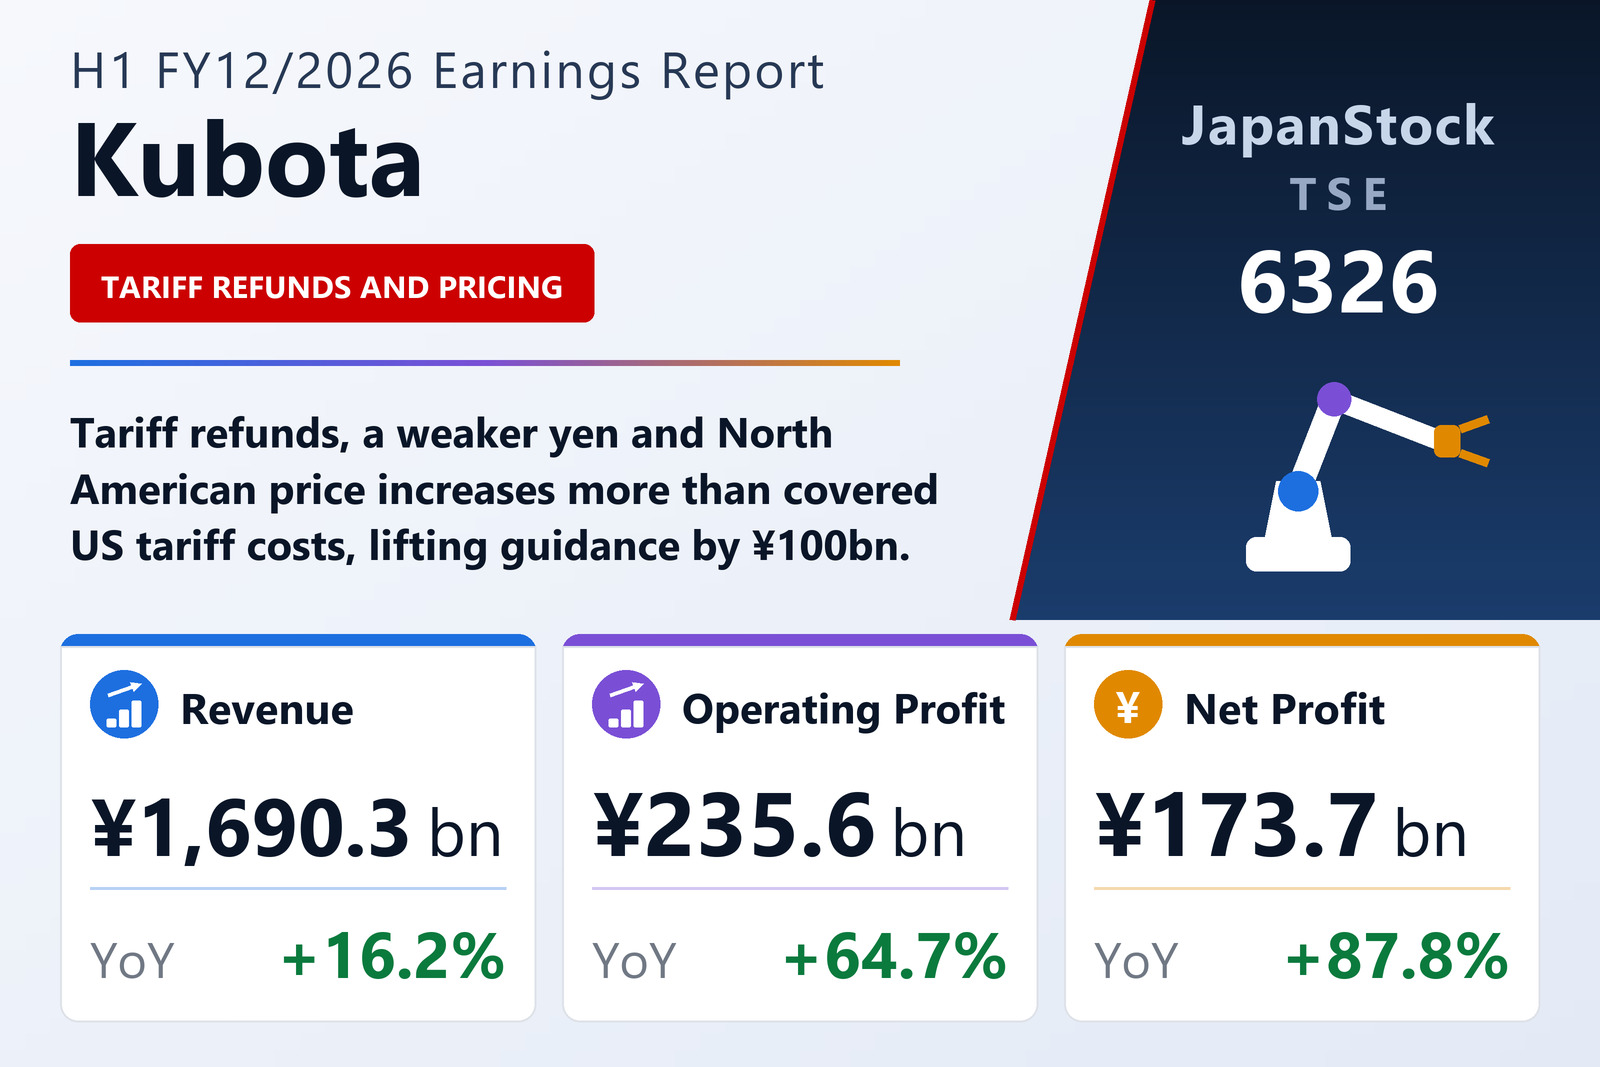
Kubota Corporation (TSE: 6326), Japan's largest maker of agricultural machinery and a major producer of compact construction equipment and ductile iron pipe, reported consolidated interim results for the six months to June 30, 2026 under IFRS. Because Kubota runs a December fiscal year-end, this is the company's half-year result, not a first quarter. Revenue rose 16.2% to ¥1,690,280 million, operating profit jumped 64.7% to ¥235,567 million, profit before tax climbed 63.6% to ¥247,751 million, and profit attributable to owners of the parent surged 87.8% to ¥173,681 million. Basic earnings per share came in at ¥152.96, against ¥80.60 a year earlier.
The operating margin widened to 13.9% from 9.8% — a 4.1-percentage-point improvement that is unusually large for a company of Kubota's scale and product mix. Management is explicit about the drivers: higher costs from US tariffs and general inflation weighed on the result, but favourable foreign exchange, refunds of tariffs already paid, and price revisions concentrated in North America, together with higher volumes in the Machinery segment, more than offset them.
Machinery does essentially all of the heavy lifting
Kubota's Farm & Industrial Machinery segment — tractors, agricultural implements, engines and construction machinery — generated ¥1,496,902 million of external revenue, up 18.1%, and accounted for 88.6% of group turnover, up from 87.1% a year ago. Segment profit rose 56.4% to ¥212,243 million, meaning Machinery alone delivered ¥76.5 billion of the group's ¥92.5 billion operating-profit increase.
Within the segment the mix shifted noticeably. Farm equipment and engines grew 13.1% to ¥1,125,356 million, but construction machinery grew far faster, up 36.4% to ¥371,546 million and lifting its share of group revenue to 22.0% from 18.7%. Domestic machinery sales rose 13.1% to ¥196,817 million on stronger farm equipment and engine demand; overseas machinery sales rose 18.9% to ¥1,300,085 million.
The regional picture underneath those numbers is more mixed than the headline suggests. In North America, construction machinery demand held up well on public infrastructure spending and private construction activity, while tractors softened — residential-use models in particular, on a deterioration in consumer sentiment linked to Middle East tensions — and agricultural models slowed as farm incomes came under pressure. Livestock-related equipment remained firm, supported by persistently high livestock prices. In Europe, the tractor market was flat year on year on weak crop prices, but Kubota's own sales rose as the previous year's dealer destocking normalised, and construction machinery demand recovered on wider infrastructure investment. In Asia, Thailand stayed weak on depressed farm incomes, while India continued to grow on government rural-support measures and favourable agricultural conditions.
Water & Environment holds its ground on pricing
The Water & Environment segment — ductile iron and synthetic pipe systems, industrial materials such as reaction tubes, spiral steel pipe and air-conditioning equipment, and environmental plant and pumps — posted revenue of ¥186,154 million, up 3.7%, or 11.0% of the group. Domestic sales rose 5.1% to ¥157,858 million with all three businesses growing, while overseas sales fell 3.5% to ¥28,296 million, mainly on lower pipe-system volumes. Segment profit edged up 3.1% to ¥17,129 million as price increases absorbed higher raw-material costs. The much smaller Other segment saw revenue fall 9.7% to ¥7,224 million and profit fall 36.8% to ¥372 million.
One accounting note matters when reading the segment table: from this fiscal year Kubota reallocated costs that had previously sat in the "Adjustments" column into the individual business segments, and restated the prior-year comparatives accordingly. That is why Adjustments swung from a ¥9,906 million drag to a ¥5,823 million contribution — the residual line now largely reflects parent-company foreign-exchange gains and losses rather than unallocated corporate overhead.
| Segment | Revenue H1 FY12/26 (¥ billion) | Revenue H1 FY12/25 (¥ billion) | YoY | Segment profit H1 FY12/26 (¥ billion) | YoY |
|---|---|---|---|---|---|
| Farm & Industrial Machinery | 1,496.90 | 1,267.35 | +18.1% | 212.24 | +56.4% |
| — of which farm equipment & engines | 1,125.36 | 995.05 | +13.1% | — | — |
| — of which construction machinery | 371.55 | 272.30 | +36.4% | — | — |
| Water & Environment | 186.15 | 179.58 | +3.7% | 17.13 | +3.1% |
| Other | 7.22 | 8.00 | -9.7% | 0.37 | -36.8% |
| Adjustments | — | — | — | 5.82 | n.m. |
| Total | 1,690.28 | 1,454.93 | +16.2% | 235.57 | +64.7% |
North America is now 42% of the top line
Kubota's geographic disclosure underlines just how much of the group now rides on the United States. Revenue to North American customers rose 24.7% to ¥712,318 million, or 42.1% of consolidated revenue, with the United States alone accounting for ¥640,888 million, up 22.5% from ¥523,308 million. Europe grew fastest in percentage terms, up 29.2% to ¥216,909 million, while Asia excluding Japan was almost flat at ¥348,160 million (+1.2%) and other regions rose 29.3% to ¥50,994 million. Domestic Japanese revenue rose 8.9% to ¥361,899 million.
Put differently, overseas revenue climbed 18.3% to ¥1,328,381 million and now represents 78.6% of the group, against 77.2% a year earlier. That concentration cuts both ways: it is the reason a weaker yen translated so powerfully into the operating line this half, and it is also why US trade policy has become the single most important swing factor in Kubota's earnings.
The tariff paradox: a cost first, then a refund
The most distinctive feature of this result is that US tariffs appear on both sides of the ledger. Kubota states plainly that tariff-related cost increases were a drag on operating profit — the company manufactures a large share of its North American compact tractors and construction machinery in the United States but still imports substantial components and finished units. Against that, the half included refunds of tariffs previously paid, which management lists alongside foreign-exchange gains as one of the two largest positive contributors to the ¥92.5 billion operating-profit increase, together with North American price revisions and volume growth.
The refund benefit is not merely a one-off in the reported half. It is also explicitly cited as one of the reasons for the upgrade to full-year guidance, alongside further yen weakness — so management expects it to continue contributing through the second half. Investors should note the corollary: an earnings base that depends partly on tariff refunds is more sensitive to changes in US trade administration than a normal industrial cycle would imply.
Balance sheet strengthens as buybacks begin
Total assets rose ¥149,646 million to ¥6,354,555 million from the December 2025 year-end, driven mainly by higher trade receivables in North America — receivables grew to ¥1,106,700 million from ¥1,001,683 million, and inventories to ¥718,916 million from ¥688,893 million. On the other side, total liabilities actually fell slightly to ¥3,314,309 million from ¥3,331,885 million as trade payables and other financial liabilities declined.
Equity attributable to owners of the parent rose 6.5% to ¥2,794,766 million on retained earnings and a positive currency-translation swing, lifting the equity-attributable-to-owners ratio 1.7 percentage points to 44.0%. Notably, Kubota was buying back stock: treasury shares climbed to 12,324,322 from 1,652,299 against 1,138,716,846 shares issued, with ¥30,768 million of cash spent on repurchases during the half. Dividends of ¥28,435 million were paid to owners of the parent and ¥9,578 million to non-controlling interests. Comprehensive income for the period swung to a positive ¥236,632 million from a negative ¥19,007 million, as a ¥35,496 million favourable currency-translation adjustment replaced last year's ¥137,520 million negative mark.
Cash flow improves on all three lines
Operating cash flow rose to ¥190,594 million from ¥142,791 million, a ¥47,803 million improvement that reflects the higher interim profit plus a reduction in finance receivables. Investing outflows narrowed to ¥68,578 million from ¥79,955 million on lower purchases of property, plant and equipment, leaving free cash flow of roughly ¥122.0 billion against ¥62.8 billion a year earlier — close to a doubling. Financing outflows also shrank, to ¥107,586 million from ¥142,864 million, mainly because short-term borrowing repayments were smaller. Adding a ¥11,893 million positive currency effect, cash and equivalents ended the half at ¥303,282 million, up ¥26,323 million from the ¥276,959 million opening balance.
Guidance raised by ¥100 billion at the operating line
Kubota lifted every line of its full-year FY12/2026 forecast from the plan published on February 12, 2026. Revenue guidance rises ¥130 billion to ¥3,280,000 million (+8.6%) on further yen weakness. Operating profit is raised ¥100 billion, or 33.3%, to ¥400,000 million (+50.7%) — the yen and the US tariff refunds outweighing higher raw-material costs tied to Middle East disruption. Profit before tax rises ¥100 billion to ¥417,000 million (+47.8%), and profit attributable to owners of the parent rises ¥79 billion to ¥289,000 million (+54.8%), with forecast EPS of ¥255.55 against ¥184.69 previously and ¥163.44 actually delivered in FY12/2025. The forecast assumes ¥157 to the US dollar and ¥183 to the euro.
Measured against that upgraded plan, the first half represents 51.5% of the revenue target but 58.9% of the operating-profit target and 60.1% of the net-profit target — a front-loaded shape that leaves the guidance looking attainable if the tariff-refund and currency assumptions hold.
Interim dividend lifted to ¥26.00
Kubota declared an interim dividend of ¥26.00 per share, up from ¥25.00 a year earlier, with payment beginning September 1, 2026. The company maintains its year-end forecast of ¥26.00, for a full-year dividend of ¥52.00 against ¥50.00 in FY12/2025 — a 4.0% increase, unchanged from the previously announced dividend plan. The interim report is scheduled for filing on August 7, 2026; as is standard for a Japanese quarterly tanshin, the figures have not been subject to audit or review.
| Metric | H1 FY12/2026 | H1 FY12/2025 | YoY |
|---|---|---|---|
| Revenue (¥ billion) | 1,690.28 | 1,454.93 | +16.2% |
| Operating profit (¥ billion) | 235.57 | 143.03 | +64.7% |
| Operating margin (%) | 13.9 | 9.8 | +4.1pt |
| Profit before tax (¥ billion) | 247.75 | 151.45 | +63.6% |
| Profit for the period (¥ billion) | 185.69 | 117.38 | +58.2% |
| Profit attributable to owners of parent (¥ billion) | 173.68 | 92.48 | +87.8% |
| Comprehensive income attrib. to owners (¥ billion) | 227.70 | -28.63 | n.m. |
| Basic EPS (¥) | 152.96 | 80.60 | +89.8% |
| Operating cash flow (¥ billion) | 190.59 | 142.79 | +33.5% |
| Free cash flow (¥ billion) | 122.02 | 62.84 | +94.2% |
| Total assets (¥ billion) | 6,354.56 | 6,204.91 | +2.4% |
| Equity attributable to owners (¥ billion) | 2,794.77 | 2,622.99 | +6.5% |
| Equity-to-owners ratio (%) | 44.0 | 42.3 | +1.7pt |
| Interim dividend per share (¥) | 26.00 | 25.00 | +4.0% |
| FY12/2026 guidance — revenue (¥ billion) | 3,280.00 | 3,018.89 | +8.6% |
| FY12/2026 guidance — operating profit (¥ billion) | 400.00 | 265.47 | +50.7% |
| FY12/2026 guidance — profit attributable (¥ billion) | 289.00 | 186.69 | +54.8% |
JapanStockPulse provides informational content only and does not constitute investment advice. Figures are taken from the company's published earnings short report and may be subject to subsequent revision.