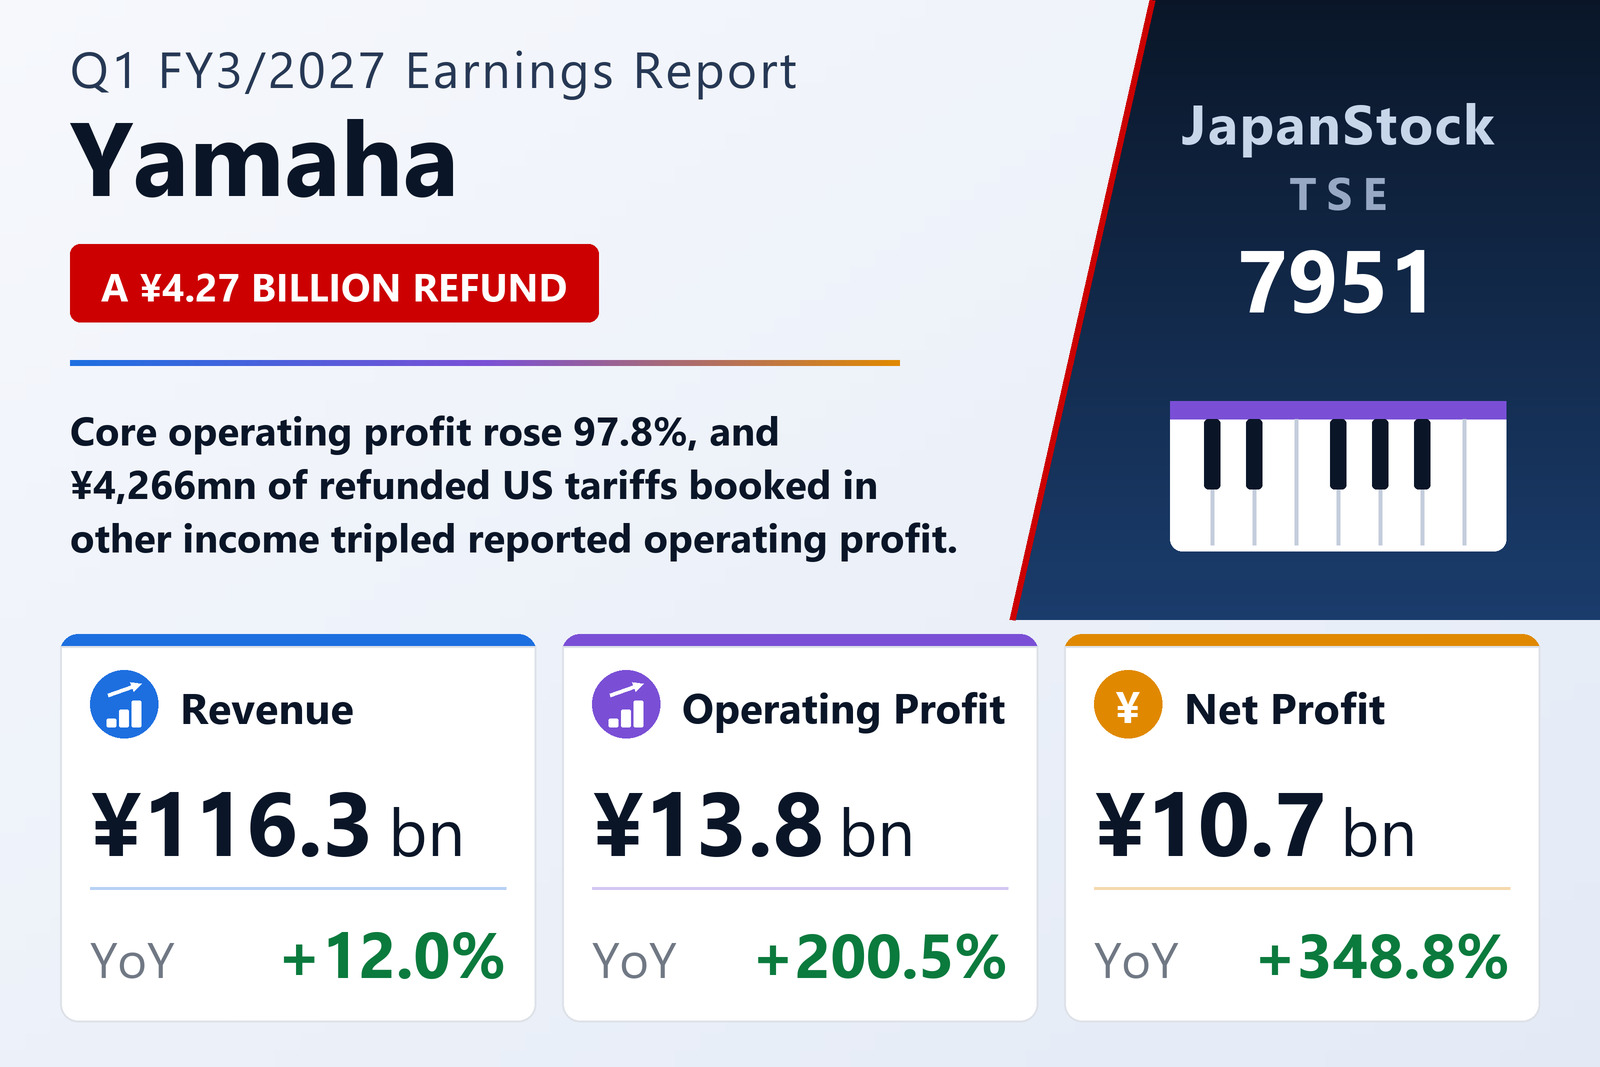
Yamaha Corporation (TSE: 7951), the world's largest maker of musical instruments and a substantial supplier of professional and consumer audio equipment, reported consolidated first-quarter results for the three months to June 30, 2026 under IFRS. Revenue rose 12.0% to ¥116,335 million, core operating profit — the company's "business profit" measure, defined as gross profit less selling, general and administrative expenses and broadly equivalent to Japanese-GAAP operating profit — nearly doubled, up 97.8% to ¥9,288 million, and IFRS operating profit tripled, up 200.5% to ¥13,791 million. Profit attributable to owners of the parent jumped 348.8% to ¥10,690 million, lifting basic earnings per share to ¥24.30 from ¥5.26. There was no dilution.
Instruments lead a 12% revenue rebound
The quarter is a clean reversal of a very weak comparison. In the same three months of the prior year, revenue had fallen 7.4% and business profit had halved, dropping 49.2%; net profit had collapsed 74.7%. This time the operating leverage worked in Yamaha's favour. Gross profit expanded 21.1% to ¥46,883 million from ¥38,720 million, well ahead of the 12.0% revenue gain, because cost of sales rose only 6.6% to ¥69,452 million. That pushed the gross margin to 40.3% from 37.3% — a three-point improvement that reflects both a better product mix and the pass-through of earlier pricing actions. Selling, general and administrative expenses grew 10.5% to ¥37,594 million, a shade slower than revenue, so the core operating margin nearly doubled to 8.0% from 4.5%.
A ¥4.27 billion tariff refund is the swing factor between the two profit lines
The gap between a 97.8% rise in business profit and a 200.5% rise in operating profit sits entirely in "other income", which ballooned to ¥4,762 million from just ¥166 million a year earlier. The bulk of it is a tariff windfall. Yamaha's U.S. subsidiaries — Yamaha Corporation of America and Yamaha Guitar Group, Inc. — began filing refund claims in April 2026 after the U.S. Supreme Court ruled that tariffs imposed under the International Emergency Economic Powers Act (IEEPA) were invalid. Refunds completed or confirmed during the quarter totalled ¥4,266 million and were booked in full to other income. Strip that item out and operating profit would have been roughly ¥9.5 billion — still more than double the prior year, but a materially less dramatic headline. Other expenses were broadly flat at ¥260 million against ¥274 million.
Below the operating line, the tailwinds continued. Finance income rose to ¥1,141 million from ¥747 million, while finance costs fell sharply to ¥142 million from ¥1,548 million — a ¥1.4 billion improvement driven largely by foreign-exchange movements on the financing account. A ¥10 million loss from equity-method investees was immaterial. Profit before tax therefore climbed 290.2% to ¥14,780 million. Income tax expense of ¥4,050 million represented an effective rate of 27.4%, down from 36.6% a year earlier when a small pre-tax base magnified fixed tax items. Non-controlling interests took ¥38 million, leaving ¥10,690 million for parent shareholders.
Segment scorecard: instrument margins nearly triple
Yamaha reports two segments — Musical Instruments and Audio Equipment — with everything else grouped under Others. Musical Instruments, which supplies pianos, digital instruments, wind, string and percussion instruments, music schools and music/video software, grew external revenue 16.8% to ¥77,684 million and more than tripled its segment profit, up 207.9% to ¥6,451 million. Its margin expanded to 8.3% from 3.1%, the single largest contributor to group earnings recovery. Audio Equipment — home audio, music production and distribution gear, professional sound, network equipment and mobility audio — grew external revenue 5.9% to ¥34,950 million with segment profit up 21.7% to ¥2,820 million and a margin of roughly 8.1% against 7.0%. Others, which houses automotive interior components, factory-automation equipment, golf products and resort operations, fell 15.0% to ¥3,700 million with segment profit all but wiped out at ¥17 million against ¥284 million.
| Segment | Revenue Q1 FY3/27 (¥ mn) | Revenue Q1 FY3/26 (¥ mn) | YoY | Segment profit Q1 FY3/27 (¥ mn) | Segment profit Q1 FY3/26 (¥ mn) | YoY |
|---|---|---|---|---|---|---|
| Musical Instruments | 77,684 | 66,537 | +16.8% | 6,451 | 2,095 | +207.9% |
| Audio Equipment | 34,950 | 32,997 | +5.9% | 2,820 | 2,317 | +21.7% |
| Others | 3,700 | 4,353 | -15.0% | 17 | 284 | -94.0% |
| Consolidated | 116,335 | 103,888 | +12.0% | 9,288 | 4,697 | +97.8% |
Balance sheet: ¥638.9 billion of assets and a 77.2% equity ratio
Total assets grew 3.5% to ¥638,949 million from ¥617,568 million at March 31, 2026, an increase of ¥21,381 million. Current assets rose 3.8% to ¥378,660 million on higher cash and inventories, while non-current assets added 3.0% to ¥260,289 million, chiefly because the market value of the group's securities holdings rose, lifting financial assets. Total liabilities increased 4.8% to ¥144,418 million, with current liabilities up 4.9% to ¥102,846 million and non-current liabilities up 4.4% to ¥41,572 million. Total equity advanced 3.1% to ¥494,531 million, and equity attributable to owners of the parent reached ¥493,129 million from ¥478,347 million, helped by retained earnings and a positive currency-translation swing. Because assets grew marginally faster than equity, the equity ratio eased to 77.2% from 77.5% — still one of the strongest balance sheets among Japan's consumer-goods manufacturers. Book value per share improved to ¥1,121.01 from ¥1,087.41.
Comprehensive income tells an even stronger story than the income statement: it reached ¥20,551 million against just ¥1,432 million a year earlier, with ¥4,977 million of foreign-currency translation gains and ¥3,039 million of fair-value gains on financial assets measured through other comprehensive income. Share count also flattered per-share figures — the weighted-average number of shares fell to 439,896,768 from 453,160,894, a 2.9% reduction following the ¥36,527 million cancellation of treasury stock executed in the prior-year quarter. Treasury holdings stood at 23,103,456 shares out of 463,000,000 issued.
Cash flow: operating inflow more than triples
Operating cash flow surged to ¥16,259 million from ¥5,092 million. Pre-tax profit of ¥14,780 million and depreciation and amortisation of ¥5,365 million did the heavy lifting, supported by a ¥9,560 million release from trade and other receivables. Working capital was not uniformly helpful: inventories absorbed ¥6,607 million against ¥1,561 million a year earlier, and trade payables drained ¥4,793 million. Income taxes paid fell to ¥3,860 million from ¥6,805 million. Investing outflows widened to ¥5,908 million from ¥2,091 million, dominated by ¥3,666 million of property, plant and equipment and intangible purchases plus ¥818 million of investment-securities acquisitions, leaving free cash flow of roughly ¥10.4 billion against ¥3.0 billion. Financing swung to a ¥394 million outflow from a ¥1,759 million inflow: a ¥6,898 million net increase in short-term borrowings was more than offset by ¥5,718 million of dividends and ¥1,430 million of lease repayments. With a ¥2,005 million positive currency effect, cash and equivalents rose ¥11,961 million to ¥120,913 million.
Guidance raised below the core line; dividend held at ¥26
Yamaha revised the full-year forecast it had issued on May 11, 2026 — but only from the operating-profit line down. Revenue guidance is unchanged at ¥490,000 million (+5.3% year on year) and business-profit guidance is unchanged at ¥38,000 million (+19.2%). Operating profit was raised 11.8% to ¥42,500 million from ¥38,000 million (+45.2% year on year), profit before tax 11.5% to ¥43,500 million from ¥39,000 million, and profit attributable to owners 10.7% to ¥31,000 million from ¥28,000 million (+30.7% year on year). Forecast EPS rises to ¥70.47 from ¥63.65. The shape of the revision is telling: management left the trading line alone and lifted only the lines that capture the tariff refunds and other non-operating items. Against those targets, the first quarter delivered 23.7% of full-year revenue and 24.4% of business profit — squarely on plan — but 32.5% of the operating-profit target and 34.5% of the net-profit target, confirming that the earnings beat is front-loaded and largely one-off in nature.
The dividend is untouched. Yamaha maintains a ¥26.00 annual dividend for FY3/2027, split evenly between a ¥13.00 interim and a ¥13.00 year-end payment, identical to FY3/2026 and unchanged from the previously announced forecast. On the revised ¥70.47 EPS guidance that implies a payout ratio of about 36.9%, down from 49.3% on the prior year's ¥52.70 of actual earnings — leaving room for the dividend to rise later if the underlying recovery holds.
Golf exit, and the end of a UK class action
Two portfolio items sit outside the numbers. As part of a review of capital allocation and business mix, Yamaha has decided to terminate its golf-products business, one of the operations grouped inside the Others segment — a small revenue line but a further step in concentrating the group on instruments and audio. Separately, a long-running contingent liability has fallen away. Yamaha Music Europe GmbH was served on December 29, 2022 with a UK class action alleging that it engaged in resale price maintenance with certain dealers in online sales of Yamaha instruments between March 2013 and March 2017, following a competition-law decision on the same conduct. The claim, brought on behalf of affected UK consumers by the consumer body Which? with Elisabetta Sciallis as class representative, never specified a damages figure, and Yamaha recorded no provision. After the quarter end, the claimants' application to discontinue was granted and the proceedings ended, so the matter no longer qualifies as a contingent liability; Yamaha says the effect on this year's results is minor. No other material subsequent events were disclosed, and the quarterly statements have not been reviewed by an audit firm.
| Metric | Q1 FY3/2027 | Q1 FY3/2026 | YoY |
|---|---|---|---|
| Revenue (¥ mn) | 116,335 | 103,888 | +12.0% |
| Gross profit (¥ mn) | 46,883 | 38,720 | +21.1% |
| Gross margin (%) | 40.3 | 37.3 | +3.0 pt |
| Core operating profit / business profit (¥ mn) | 9,288 | 4,697 | +97.8% |
| Operating profit (¥ mn) | 13,791 | 4,589 | +200.5% |
| Profit before tax (¥ mn) | 14,780 | 3,788 | +290.2% |
| Profit attributable to owners (¥ mn) | 10,690 | 2,382 | +348.8% |
| Comprehensive income (¥ mn) | 20,551 | 1,432 | +1,335.1% |
| Basic EPS (¥) | 24.30 | 5.26 | +362.0% |
| Operating cash flow (¥ mn) | 16,259 | 5,092 | +219.3% |
| Total assets (¥ mn) | 638,949 | 617,568 | +3.5% |
| Equity attributable to owners (¥ mn) | 493,129 | 478,347 | +3.1% |
| Equity ratio (%) | 77.2 | 77.5 | -0.3 pt |
| Book value per share (¥) | 1,121.01 | 1,087.41 | +3.1% |
| Cash and equivalents (¥ mn) | 120,913 | 108,952 | +11.0% |
| FY3/2027 guidance — operating profit (¥ mn) | 42,500 | 38,000 | +11.8% |
| FY3/2027 guidance — profit attributable (¥ mn) | 31,000 | 28,000 | +10.7% |
JapanStockPulse provides informational content only and does not constitute investment advice. Figures are taken from the company's published earnings short report and may be subject to subsequent revision.