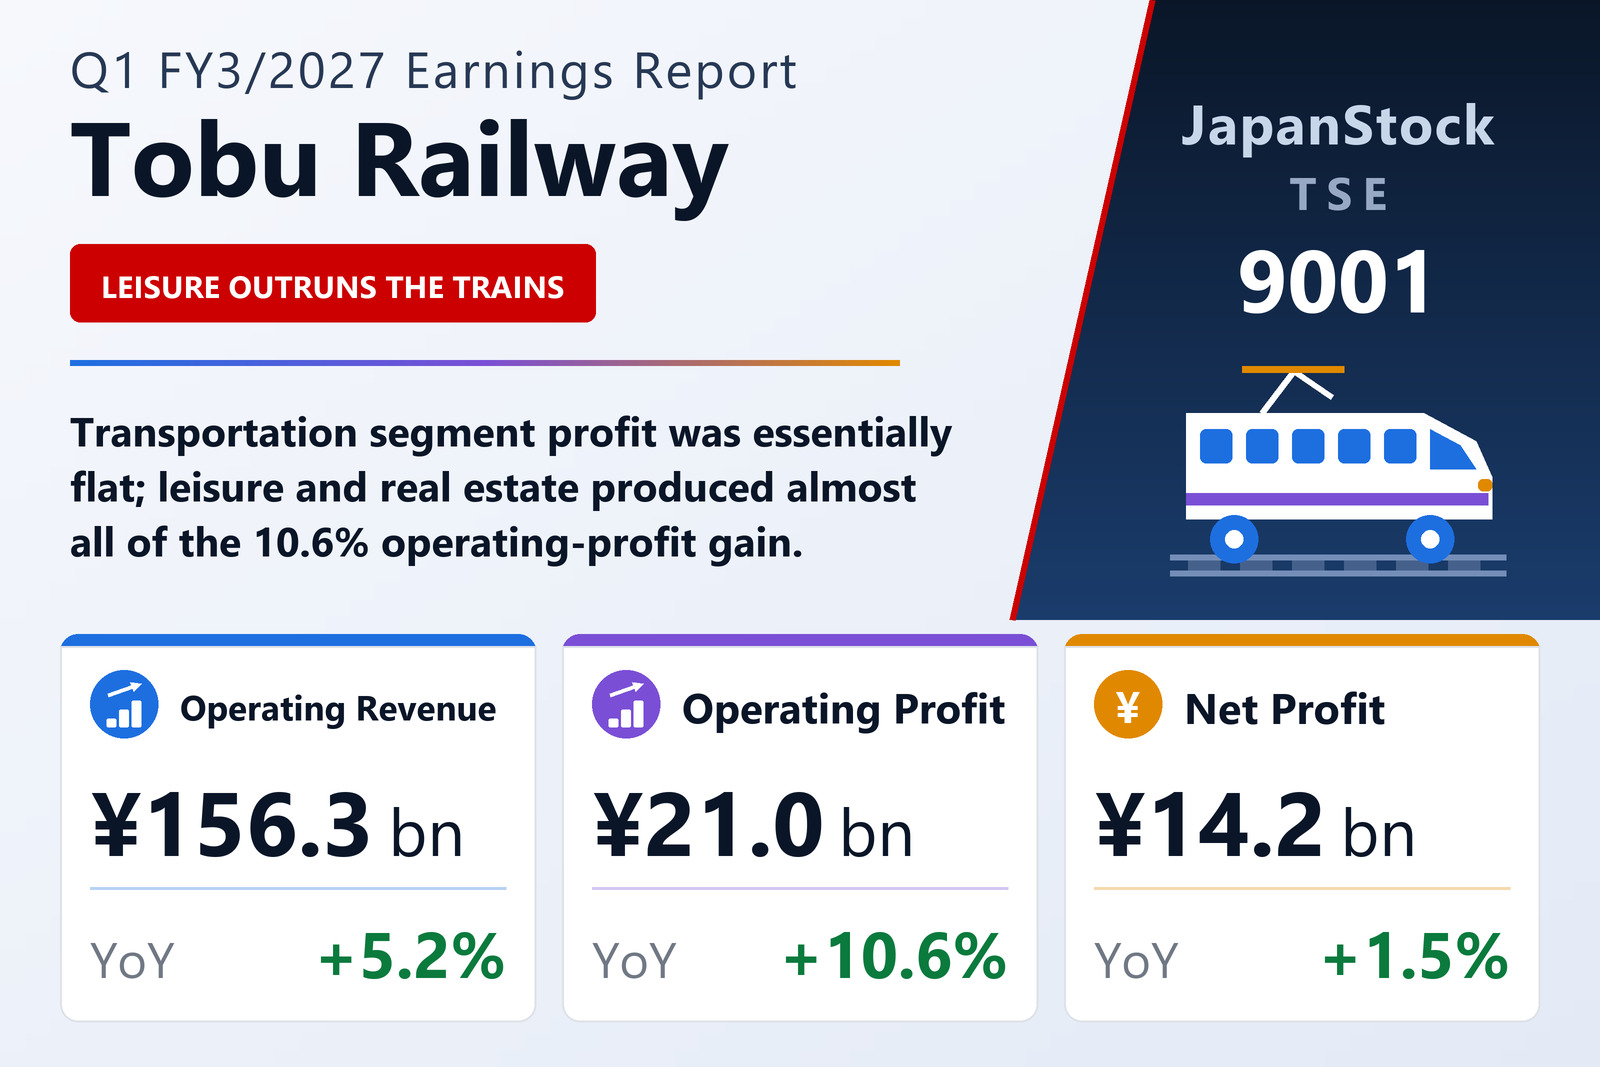
Tobu Railway Co., Ltd. (TSE: 9001), operator of Japan's longest private railway network outside the Kansai majors and the owner of Tokyo Skytree, reported consolidated first-quarter results for the three months to June 30, 2026 under Japanese GAAP. Operating revenue rose 5.2% to ¥156,292 million, operating profit 10.6% to ¥21,017 million and ordinary profit 9.5% to ¥20,712 million. Profit attributable to owners of the parent, however, advanced only 1.5% to ¥14,193 million. Earnings per share came in at ¥72.59 against ¥70.40, a 3.1% rise that outpaced net profit because the average share count fell 1.6% year on year to 195.5 million. The company left its full-year guidance untouched.
The tanshin itself carries no management discussion: Tobu directs readers to the supplementary presentation filed the same day and to an analyst briefing scheduled for August 5. What the disclosure does contain — a full segment table, balance sheet and income statement — tells a clear enough story on its own.
The railway is flat; everything around it is growing
The Transportation segment, which runs the 463-kilometre Tobu network linking Asakusa and Ikebukuro to Nikko, Kinugawa and northern Kanto, produced external revenue of ¥55,471 million, up 2.4%, but segment profit of ¥10,262 million — up just ¥6 million, or 0.1%. Passenger volumes and fare income are clearly still growing, yet cost inflation on wages, energy and maintenance absorbed the whole of it. That is the single most important number in the release: the largest and most capital-intensive business in the group is running to stand still.
Everything else did better. Leisure lifted external revenue 7.3% to ¥38,398 million and profit 10.4% to ¥3,831 million — the segment that houses Tokyo Skytree and Tokyo Skytree Town, the Tobu Hotel chain, Tobu Zoo and the Nikko-area resorts and sightseeing boats, and therefore the group's most direct exposure to the continuing inbound-tourism boom in Asakusa and Nikko. Real Estate grew external revenue 10.4% to ¥10,691 million and profit 22.3% to ¥3,871 million, the fastest profit growth of any reportable segment and a reminder that Tobu is also a substantial landlord and residential developer along its own lines; the balance sheet shows land and buildings for sale rising to ¥35,957 million from ¥33,862 million as further stock is readied.
Retail & Distribution — principally the Tobu Store supermarket chain and the department-store and station-retail operations — grew external revenue only 2.4% to ¥41,535 million but converted that into a 24.4% profit gain, to ¥2,390 million, on a thin but improving 5.4% segment margin. The catch-all Other segment, which includes construction and services businesses, was the fastest-growing of all: external revenue up 21.3% to ¥10,195 million and profit nearly tripling to ¥1,179 million from ¥403 million. Together the four non-rail segments added ¥2,310 million of segment profit, against the railway's ¥6 million.
| Segment | Revenue Q1 FY3/27 | Revenue Q1 FY3/26 | YoY | Profit Q1 FY3/27 | Profit Q1 FY3/26 | YoY |
|---|---|---|---|---|---|---|
| Transportation | 55,471 | 54,188 | +2.4% | 10,262 | 10,256 | +0.1% |
| Leisure | 38,398 | 35,776 | +7.3% | 3,831 | 3,471 | +10.4% |
| Real Estate | 10,691 | 9,686 | +10.4% | 3,871 | 3,166 | +22.3% |
| Retail & Distribution | 41,535 | 40,559 | +2.4% | 2,390 | 1,921 | +24.4% |
| Other | 10,195 | 8,402 | +21.3% | 1,179 | 403 | +192.6% |
| Segment total | 156,292 | 148,613 | +5.2% | 21,535 | 19,219 | +12.1% |
| Eliminations & adjustments | — | — | — | -517 | -215 | — |
| Consolidated | 156,292 | 148,613 | +5.2% | 21,017 | 19,003 | +10.6% |
Costs grew, but revenue grew faster
Total operating costs rose 4.4% to ¥135,274 million from ¥129,609 million, comfortably below the 5.2% revenue increase — which is why the operating margin widened to 13.4% from 12.8%. Transport and cost of sales accounted for ¥102,890 million (up 5.6%) while selling, general and administrative expenses were nearly flat at ¥32,384 million against ¥32,145 million, a 0.7% rise. Depreciation, disclosed separately because Tobu does not prepare a quarterly cash-flow statement, was ¥13,861 million against ¥13,444 million, up 3.1% — a reminder that roughly two-thirds of every yen of operating profit is being consumed by the depreciation charge on a ¥1.46 trillion tangible asset base.
Interest costs bite, and the tax rate does the rest
Below the operating line the picture is less flattering. Non-operating income rose to ¥2,441 million from ¥2,180 million, helped by dividends received of ¥1,528 million, but non-operating expenses climbed faster, to ¥2,746 million from ¥2,267 million, as interest expense jumped 27.0% to ¥2,430 million from ¥1,914 million — the clearest sign yet in Tobu's numbers of the Bank of Japan's exit from ultra-low rates flowing through to a heavily geared railway balance sheet. Net non-operating items therefore swung from a ¥87 million drag to a ¥305 million drag, and ordinary profit grew 9.5%, a full point slower than operating profit.
Extraordinary items were mildly positive: gains of ¥490 million (including ¥286 million on fixed-asset disposals and ¥174 million of subsidy income) against losses of ¥367 million, leaving pre-tax profit up 9.4% at ¥20,835 million. The entire remaining gap to the +1.5% bottom line is tax. The total charge rose to ¥6,562 million from ¥5,031 million, an effective rate of 31.5% against 26.4% — largely because last year's ¥774 million deferred-tax credit turned into a ¥24 million charge. Strip the tax line out and Tobu's quarter looks materially stronger than the headline net-profit growth suggests. Comprehensive income, boosted by ¥4,885 million of unrealised gains on securities, rose 6.8% to ¥18,978 million.
Balance sheet: assets down, equity up, debt drifting higher
Total assets slipped 0.6% to ¥1,852,176 million from ¥1,863,562 million at March 31, 2026, almost entirely because current assets fell ¥16.8 billion — trade receivables dropped to ¥66,637 million from ¥77,585 million on normal seasonal collection and cash to ¥37,297 million from ¥44,370 million. Fixed assets edged up to ¥1,674,182 million, with tangible fixed assets of ¥1,461,152 million (buildings and structures ¥696,234 million, land ¥233,944 million) and investment securities marked up to ¥135,099 million from ¥127,510 million.
Net assets grew 1.9% to ¥633,865 million, of which shareholders' equity accounts for ¥627,224 million, and the equity ratio improved to 33.9% from 33.0% — a meaningful step for a railway that has historically run in the low 30s. Retained earnings rose to ¥354,193 million. On the liability side, interest-bearing debt — short- and long-term borrowings, bonds and commercial paper — totalled roughly ¥803.9 billion, up from about ¥789.0 billion, with a ¥50,000 million commercial-paper issue replacing a ¥9,800 million bond redemption and part of the short-term borrowing book. Long-term borrowings fell to ¥475,488 million from ¥483,425 million and bonds outstanding were unchanged at ¥124,000 million. Total liabilities declined to ¥1,218,310 million from ¥1,241,335 million.
Guidance untouched — and it implies a much softer rest of the year
Tobu reaffirmed the FY3/2027 forecast issued with its full-year results: operating revenue of ¥673,000 million (+2.7%), operating profit of ¥72,000 million (+0.2%), ordinary profit of ¥63,500 million (−7.7%) and net profit of ¥56,000 million (+0.7%), for EPS of ¥286.39. Set against a first quarter that delivered +5.2% revenue, +10.6% operating profit and +9.5% ordinary profit, the guidance is conspicuously conservative — Q1 already represents 29.2% of the full-year operating-profit target and 32.6% of the ordinary-profit target, well ahead of a straight-line quarter.
The ordinary-profit line is the one to watch: management is guiding for a full-year decline of 7.7% after a quarter that grew 9.5%, which implies either a sharp step-up in interest expense over the remaining nine months, the absence of non-operating items that flattered the first quarter, or simple caution ahead of the summer travel season. Investors should treat the unchanged forecast as a floor rather than an expectation until the second quarter clarifies which.
Dividend lifted to ¥75.00
The dividend forecast was also left unrevised — but it already embeds an increase. Against FY3/2026's total of ¥70.00 per share (a ¥32.50 interim plus a ¥37.50 year-end), Tobu plans ¥75.00 for FY3/2027, split evenly as ¥37.50 at the half-year and ¥37.50 at the year-end. That is a 7.1% increase and lifts the interim payment by ¥5.00, implying a payout ratio of about 26% on guided EPS of ¥286.39. No quarter-end dividend is paid. Shares issued were unchanged at 197,266,821, with treasury stock slightly reduced to 1,727,246 shares from 1,735,470; the quarterly financial statements have not been reviewed by an accounting auditor, and Tobu reported no changes to its scope of consolidation, no accounting-policy changes and no going-concern issues.
| Metric | Q1 FY3/2027 | Q1 FY3/2026 | YoY |
|---|---|---|---|
| Operating revenue | 156,292 | 148,613 | +5.2% |
| Operating costs | 135,274 | 129,609 | +4.4% |
| Operating profit | 21,017 | 19,003 | +10.6% |
| Operating margin (%) | 13.4 | 12.8 | +0.7pt |
| Ordinary profit | 20,712 | 18,916 | +9.5% |
| Pre-tax profit | 20,835 | 19,042 | +9.4% |
| Profit attributable to owners of the parent | 14,193 | 13,989 | +1.5% |
| Comprehensive income | 18,978 | 17,768 | +6.8% |
| Earnings per share (¥) | 72.59 | 70.40 | +3.1% |
| Interest expense | 2,430 | 1,914 | +27.0% |
| Effective tax rate (%) | 31.5 | 26.4 | +5.1pt |
| Depreciation | 13,861 | 13,444 | +3.1% |
| Total assets | 1,852,176 | 1,863,562 | -0.6% |
| Net assets | 633,865 | 622,227 | +1.9% |
| Equity ratio (%) | 33.9 | 33.0 | +0.9pt |
| FY3/2027 guidance — operating revenue | 673,000 | — | +2.7% |
| FY3/2027 guidance — operating profit | 72,000 | — | +0.2% |
| FY3/2027 guidance — ordinary profit | 63,500 | — | -7.7% |
| FY3/2027 guidance — net profit | 56,000 | — | +0.7% |
| FY3/2027 dividend forecast (¥/share) | 75.00 | 70.00 | +7.1% |
JapanStockPulse provides informational content only and does not constitute investment advice. Figures are taken from the company's published earnings short report and may be subject to subsequent revision.