A record top line
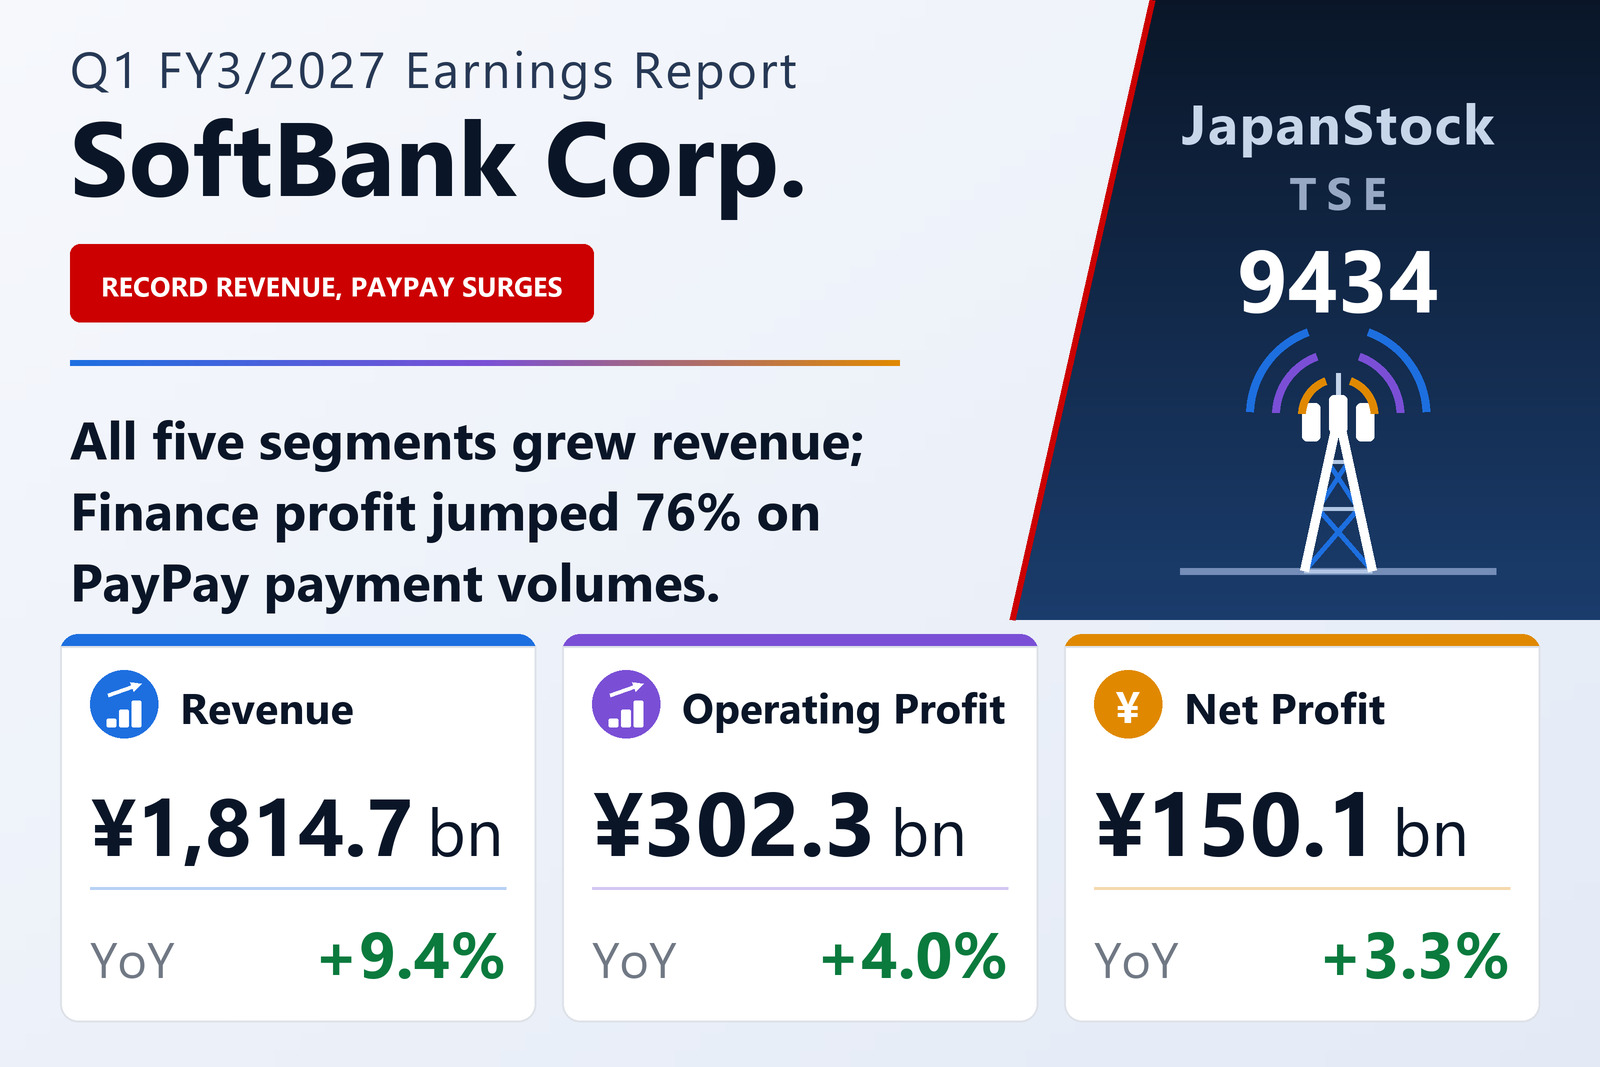
SoftBank Corp. (TSE: 9434) published consolidated first-quarter results for FY3/2027 on August 4, 2026, covering April 1 to June 30, 2026 under IFRS. Revenue rose 9.4% to ¥1,814,722 million — the company's highest ever quarterly figure — and operating profit 4.0% to ¥302,298 million. Adjusted EBITDA, the measure management uses to track cash generation, climbed 7.9% to ¥508,100 million.
Growth was broad rather than concentrated: every one of the five reporting segments increased revenue. Distribution contributed the largest single increment at ¥56,600 million, followed by Media & EC at ¥39,900 million, Consumer at ¥31,900 million, Enterprise at ¥26,600 million and Finance at ¥24,600 million.
Finance and Enterprise carry the profit line
Finance was the standout. Segment revenue rose 27.0% to ¥115,900 million and segment profit 76.0% to ¥31,800 million, driven by higher transaction volumes across PayPay's QR-code payment service and PayPay Card. Enterprise followed with a 27.5% profit gain to ¥62,200 million as corporate customers spent more on digitalisation and solution work, and Distribution added 8.2% to ¥12,900 million on cloud, SaaS and ICT products sold to business buyers.
Two segments went the other way. Media & EC profit fell 5.7% to ¥66,700 million, chiefly because a remeasurement gain on a business combination booked a year earlier did not repeat. Consumer, still the largest profit pool at ¥152,900 million, edged down 0.6% as operating expenses rose 5.8% against 4.4% revenue growth.
Minorities take a larger share
Group net profit rose 10.5% to ¥201,491 million, but the portion attributable to owners of the parent advanced only 3.3% to ¥150,070 million. The gap is non-controlling interests, which absorbed ¥51,400 million — up 39.0% — mainly because net profit at the LINE Yahoo group, including PayPay, increased.
Balance sheet and outlook
Total assets grew 4.5% to ¥19,342,584 million, while equity attributable to owners of the parent slipped 1.5% to ¥2,912,232 million; the ratio of parent equity to total assets fell to 15.1% from 16.0%. Management reaffirmed full-year FY3/2027 guidance issued on May 11, 2026: revenue of ¥7,500,000 million, operating profit of ¥1,100,000 million and net profit attributable to owners of the parent of ¥560,000 million. The annual dividend forecast stands at ¥8.80 per share against ¥8.60 paid for FY3/2026.
| Metric | Q1 FY3/2027 | Q1 FY3/2026 | Change |
|---|---|---|---|
| Revenue (¥ million) | 1,814,722 | 1,658,615 | +9.4% |
| Operating profit (¥ million) | 302,298 | 290,734 | +4.0% |
| Adjusted EBITDA (¥ million) | 508,100 | 471,000 | +7.9% |
| Pre-tax profit (¥ million) | 281,165 | 270,434 | +4.0% |
| Net profit (¥ million) | 201,491 | 182,300 | +10.5% |
| Net profit attrib. to owners of parent (¥ million) | 150,070 | 145,310 | +3.3% |
| Comprehensive income (¥ million) | 218,505 | 201,419 | +8.5% |
| EPS (¥) | 3.09 | 3.00 | +3.0% |
| Consumer — revenue (¥ million) | 749,700 | 717,800 | +4.4% |
| Consumer — segment profit (¥ million) | 152,900 | 153,800 | -0.6% |
| Enterprise — revenue (¥ million) | 260,400 | 233,800 | +11.4% |
| Enterprise — segment profit (¥ million) | 62,200 | 48,800 | +27.5% |
| Distribution — revenue (¥ million) | 304,500 | 247,900 | +22.8% |
| Distribution — segment profit (¥ million) | 12,900 | 11,900 | +8.2% |
| Media & EC — revenue (¥ million) | 446,800 | 406,900 | +9.8% |
| Media & EC — segment profit (¥ million) | 66,700 | 70,700 | -5.7% |
| Finance — revenue (¥ million) | 115,900 | 91,300 | +27.0% |
| Finance — segment profit (¥ million) | 31,800 | 18,100 | +76.0% |
| Total assets (¥ million) | 19,342,584 | 18,502,175 | +4.5% |
| Equity attrib. to owners of parent (¥ million) | 2,912,232 | 2,957,859 | -1.5% |
| Equity ratio | 15.1% | 16.0% | -0.9 pt |
| FY3/2027 guidance — revenue (¥ million) | 7,500,000 | — | +6.6% |
| FY3/2027 guidance — operating profit (¥ million) | 1,100,000 | — | +5.5% |
| FY3/2027 guidance — net profit (¥ million) | 560,000 | — | +1.7% |
| FY3/2027 guidance — EPS (¥) | 11.54 | — | — |
| Annual dividend per share | 8.80 | 8.60 | +2.3% |
JapanStockPulse provides informational content only and does not constitute investment advice. Figures are taken from the company's published earnings short report and may be subject to subsequent revision.