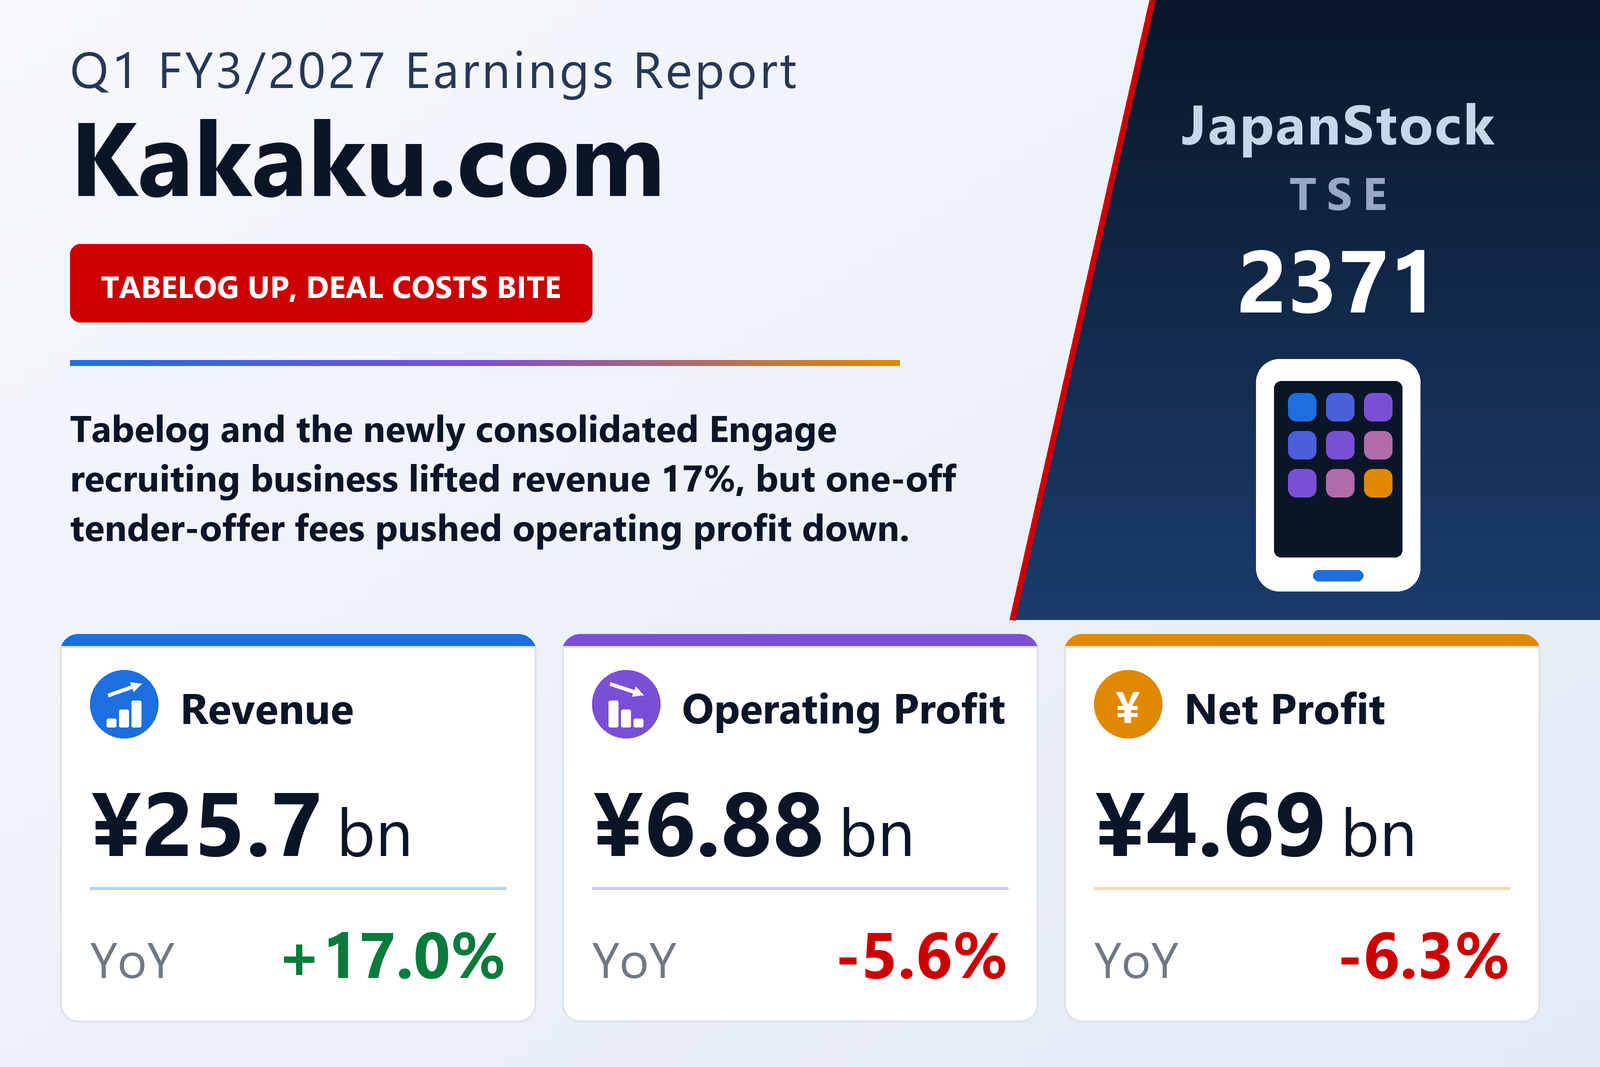
Kakaku.com, Inc. (TSE: 2371), the internet-media group behind the Kakaku.com shopping-comparison site, the Tabelog restaurant guide and the Kyujin Box job-search engine, reported consolidated results for the first quarter of the year to March 2027 (April 1 to June 30, 2026) under IFRS. Revenue rose 17.0% to ¥25,700 million, but operating profit fell 5.6% to ¥6,884 million, profit before tax declined 4.7% to ¥6,919 million and profit attributable to owners of the parent dropped 6.3% to ¥4,689 million. Basic earnings per share were ¥23.70, down from ¥25.31, and diluted EPS was ¥23.69. Adjusted EBITDA — a new headline metric the company introduced from this fiscal year — came to ¥8,955 million.
Tabelog powers the top line
The growth came overwhelmingly from restaurants and recruiting. Tabelog revenue rose 17.9% to ¥10,918 million and segment profit jumped 20.1% to ¥6,276 million, driven by more paid-plan restaurants and higher online booking volumes. Online reservations reached 37.03 million for the quarter, up 24.4% year on year, paid-plan restaurants stood at 102,800 at the end of June, and monthly users of the site were 90.49 million in June 2026. The Incubation segment — which spans the Smaity property portal, the Fortravel travel review site, dynamic-package developer Time Design and home-services platform LiPLUS — grew revenue 14.7% to ¥2,525 million and lifted segment profit 44.6% to ¥565 million on strength in travel and home-living services.
The legacy Kakaku.com segment went the other way. Revenue slipped 5.4% to ¥5,518 million and segment profit fell 9.1% to ¥2,847 million: shopping-comparison held up, but the financial-services vertical — credit cards, card loans and mortgages — declined from a year earlier and dragged the whole segment down. Monthly users of Kakaku.com were 26.88 million in June 2026.
Engage consolidation reshapes the HR segment
The single biggest change to the group's shape is the acquisition of Engage Inc., consolidated for the first time this quarter. Kakaku.com bought 85.1% of the voting rights on April 1, 2026 for cash consideration of ¥5,154 million (a ¥4,454 million base price plus a ¥700 million contractual adjustment settled in June), recognising ¥4,943 million of goodwill allocated to the HR segment. Reflecting the deal, the reporting segment previously called Kyujin Box was renamed HR and now comprises Kyujin Box, Engage and the U.S.-based Jobcube.
HR revenue rose 44.5% to ¥6,741 million — Kyujin Box contributed ¥5,327 million, up 14.2%, and Engage added ¥1,413 million — yet segment profit fell 36.0% to ¥228 million as the newly consolidated business and continued sales-force expansion at Kyujin Box absorbed the gain. Since the acquisition date, Engage has contributed ¥1,413 million of revenue and a quarterly loss of ¥63 million to the group accounts, and acquisition-related costs of ¥55 million were booked in operating expenses.
Tender-offer costs, not operations, drove the profit dip
Reported operating profit fell despite broad-based segment growth. Combined segment profit across the four businesses actually rose 8.9% to ¥9,915 million; what turned that into a decline was the unallocated corporate line, which widened to ¥3,031 million from ¥1,819 million a year earlier. The company attributes the increase mainly to one-off fees paid to financial advisers, lawyers and other specialists in responding to a tender offer for Kakaku.com shares. Purchase-accounting for Engage remains provisional at quarter-end, so the allocation of the acquisition price is not yet final.
Balance sheet expands on goodwill
Total assets grew ¥7,730 million to ¥100,205 million, with goodwill and intangible assets up ¥7,497 million to ¥18,900 million on the Engage purchase. Total liabilities rose ¥7,891 million to ¥35,196 million, including a ¥4,500 million increase in short-term borrowings. Total equity edged down ¥161 million to ¥65,009 million as the ¥4,689 million quarterly profit was more than offset by ¥4,959 million of dividends paid; equity attributable to owners of the parent was ¥64,804 million and the equity ratio fell to 64.7% from 70.3% at the previous year-end. Operating cash flow was ¥3,564 million (versus ¥4,928 million a year earlier), investing outflows narrowed sharply to ¥1,182 million, and period-end cash stood at ¥48,007 million.
Guidance intact; no dividend forecast for FY3/2027
Management left its full-year outlook unchanged from the May 8, 2026 announcement, guiding FY3/2027 revenue of ¥114,500 million (+21.6%), operating profit of ¥30,800 million (+13.1%), profit before tax of ¥30,700 million (+12.3%), profit attributable to owners of ¥20,700 million (+10.1%), EPS of ¥104.63 and adjusted EBITDA of ¥36,000 million. First-half guidance is revenue of ¥53,700 million (+19.7%), operating profit of ¥13,700 million (−1.0%), profit before tax of ¥13,700 million (+1.1%), profit attributable of ¥9,200 million (−1.8%) and adjusted EBITDA of ¥16,300 million — a shape that already builds in the Q1 profit dip.
On shareholder returns, the company paid a ¥25.00 interim and a ¥25.00 year-end dividend in FY3/2026 for a ¥50.00 annual total, and disbursed ¥4,959 million of dividends during the quarter. For FY3/2027 the disclosure shows a dividend forecast of ¥0.00 at the interim, ¥0.00 at the year-end and ¥0.00 for the full year, unchanged from the company's previously announced forecast.
| Metric | Q1 FY3/2027 | Q1 FY3/2026 | YoY |
|---|---|---|---|
| Revenue (¥ million) | 25,700 | 21,958 | +17.0% |
| Operating profit (¥ million) | 6,884 | 7,288 | -5.6% |
| Profit before tax (¥ million) | 6,919 | 7,260 | -4.7% |
| Profit attrib. to owners (¥ million) | 4,689 | 5,006 | -6.3% |
| Basic EPS (¥) | 23.70 | 25.31 | -6.4% |
| Adjusted EBITDA (¥ million) | 8,955 | — | — |
| Total assets (¥ million) | 100,205 | 92,475 | +8.4% |
| Equity ratio (%) | 64.7 | 70.3 | -5.6pt |
| FY3/2027 revenue guidance (¥ million) | 114,500 | — | +21.6% |
| FY3/2027 operating profit guidance (¥ million) | 30,800 | — | +13.1% |
JapanStockPulse provides informational content only and does not constitute investment advice. Figures are taken from the company's published earnings short report and may be subject to subsequent revision. Total assets and equity ratio are compared with the March 31, 2026 fiscal year-end.