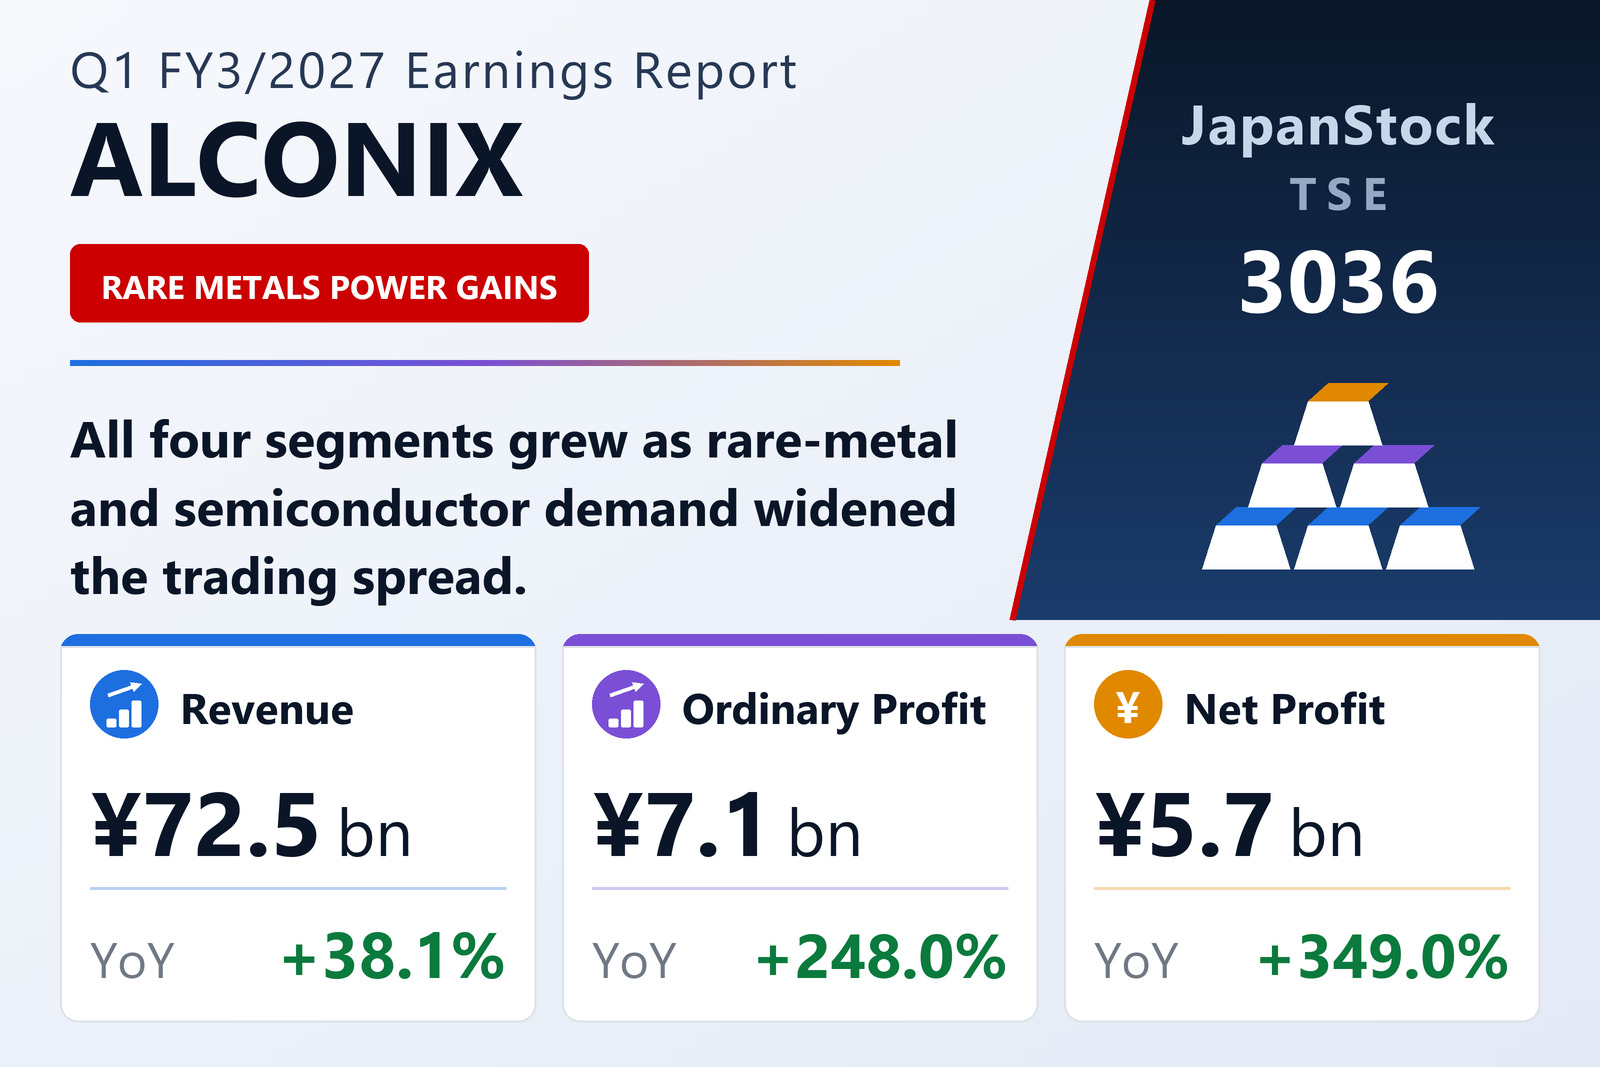
Revenue up 38%, ordinary profit up 248%
ALCONIX Corporation (TSE: 3036), a non-ferrous metals trading house that also manufactures device materials and processed metal parts, reported consolidated first-quarter results for the three months to June 30, 2026 under Japanese GAAP on August 5, 2026. Revenue rose 38.1% to ¥72,512 million from ¥52,506 million. Operating profit rose 183.4% to ¥6,930 million, ordinary profit 248.0% to ¥7,143 million, and net profit attributable to owners of the parent 349.0% to ¥5,691 million. Earnings per share were ¥189.30 against ¥42.34, and ¥189.11 diluted.
The mechanics are unusually clean. Gross profit rose 64.5% to ¥12,122 million — far faster than the 38.1% revenue gain, so the group sold more and at a wider spread. Selling, general and administrative expenses rose only 5.4% to ¥5,191 million on higher personnel costs. A ¥4,753 million gross-profit gain against a ¥267 million cost increase is what produces a 183.4% operating-profit gain from a 38.1% revenue gain.
Ordinary profit then outruns operating profit again because the non-operating line flipped. Net non-operating income was a ¥212 million inflow, mainly on gains from derivative valuations, against a ¥393 million outflow a year earlier — a ¥605 million swing on top of the operating gain.
All four segments up, on rare metals and semiconductors
ALCONIX reports four segments and every one of them grew revenue and profit. Note that the group revised how it allocates corporate costs this quarter, and the prior-year comparatives below are restated on the new basis. Segment profit is measured at the ordinary-profit level, and segment revenue includes intersegment sales.
Trading — electronic functional materials was the fastest mover: revenue of ¥18,094 million, up 62.5%, and profit of ¥2,757 million, up 207.6%, on rare-metal transactions. Trading — aluminium and copper, the largest by revenue at ¥30,231 million, up 37.7%, swung to a ¥1,295 million profit from an ¥88 million loss, on aluminium and copper scrap trading.
On the manufacturing side, device materials produced revenue of ¥14,851 million, up 29.1%, and profit of ¥1,551 million against ¥88 million, on semiconductor-related and electrical-equipment components in the North American market. Metal processing produced revenue of ¥11,844 million, up 19.7%, and profit of ¥1,555 million, up 40.0%, on parts for semiconductor production and mounting equipment.
The market backdrop management describes is a two-sided one. Non-ferrous prices — aluminium, copper, nickel and rare metals — stayed high, and Chinese export controls on rare metals and rare earths plus the Middle East situation prompted customers to build inventory, particularly in recycled material, generating extra demand. Against that, automotive and vehicle battery demand felt the slowdown in electric vehicles, while semiconductor demand tied to AI and data centres stayed firm in both Japan and North America. Three companies entered the scope of consolidation in the quarter: ALCONIX INDIA, FUJICARBON INDIA and Proof Mechanics.
A ¥42 billion securities mark-up rebuilds the balance sheet
The balance-sheet movement is larger than the profit and comes mostly from one line. Total assets rose ¥67,529 million to ¥289,956 million. Current assets grew ¥24,527 million on ¥11,247 million more trade receivables, ¥9,065 million more inventory and ¥4,325 million more cash — the working-capital footprint of a 38% revenue increase. Fixed assets grew ¥43,001 million, of which ¥42,115 million is a rise in investment securities.
That revaluation flows through to equity. Net assets rose ¥33,769 million to ¥113,711 million, of which ¥28,694 million is an increase in the valuation reserve for available-for-sale securities and ¥719 million is currency translation. Deferred tax liabilities inside fixed liabilities rose ¥13,208 million, the tax side of the same mark-up. Comprehensive income for the quarter was therefore ¥35,134 million against a negative ¥389 million — roughly six times the ¥5,691 million of net profit. The equity ratio improved to 39.0% from 35.6%.
It is worth separating the two. The ¥5,691 million is what the business earned; the ¥28,694 million is a market price applied to securities the company holds. Both are real, but only one recurs, and the second reverses if the market does.
Guidance and dividend both revised
ALCONIX revised both its full-year forecast and its dividend forecast alongside these results, in a separate release the same day. Full-year guidance is now revenue of ¥265,000 million, up 20.6%; operating profit of ¥14,700 million, up 50.9%; ordinary profit of ¥14,000 million, up 56.5%; and net profit of ¥9,200 million, up 64.3%, for EPS of ¥306.60.
Measured against that, the quarter is heavily front-loaded: ordinary profit of ¥7,143 million is 51.0% of the full-year figure, operating profit 47.1%, and net profit 61.9%, on 27.4% of guided revenue. The guidance therefore assumes the spread that produced this quarter's gross margin narrows over the remaining nine months.
The dividend forecast rises to ¥47.00 at the interim and ¥48.00 at the year-end, ¥95.00 for the year, against ¥42.00 and ¥45.00 for ¥87.00 in FY3/2026 — a 9.2% increase, and a payout ratio of about 31% on guided EPS.
| Metric | Q1 FY3/2027 | Q1 FY3/2026 | Change |
|---|---|---|---|
| Revenue (¥ million) | 72,512 | 52,506 | +38.1% |
| Gross profit (¥ million) | 12,122 | 7,369 | +64.5% |
| SG&A expenses (¥ million) | 5,191 | 4,924 | +5.4% |
| Operating profit (¥ million) | 6,930 | 2,445 | +183.4% |
| Ordinary profit (¥ million) | 7,143 | 2,052 | +248.0% |
| Net profit attrib. to owners of parent (¥ million) | 5,691 | 1,267 | +349.0% |
| EPS (¥) | 189.30 | 42.34 | +347.1% |
| Comprehensive income (¥ million) | 35,134 | −389 | to profit |
| Total assets (¥ million) * | 289,956 | 222,427 | +30.4% |
| Equity (¥ million) * | 112,959 | 79,226 | +42.6% |
| Equity ratio * | 39.0% | 35.6% | +3.4 pt |
JapanStockPulse provides informational content only and does not constitute investment advice. Figures are taken from the company's published earnings short report and may be subject to subsequent revision.