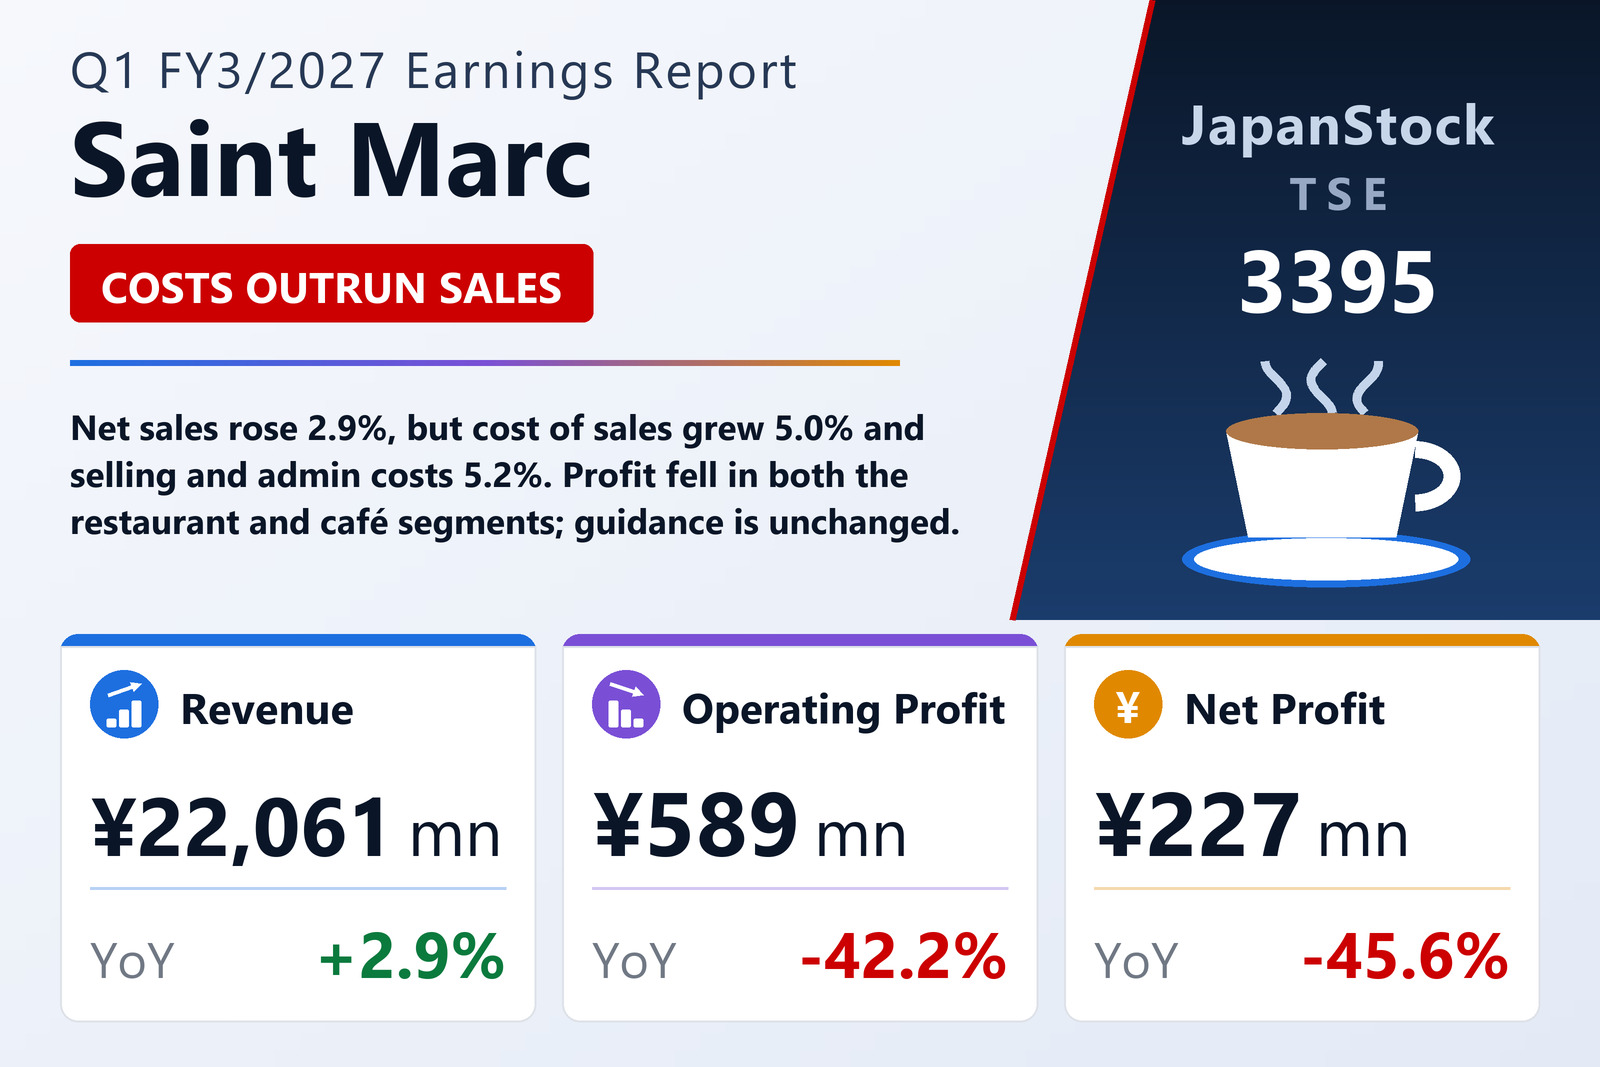
Sales grew 2.9%, and both main cost lines grew faster
Saint Marc Holdings Co., Ltd. (TSE: 3395), which runs bakery-restaurant, pasta, café and other restaurant chains, published consolidated results for the first quarter of FY3/2027, the three months from April 1 to June 30, 2026, on August 5, 2026 under Japanese GAAP. Net sales rose 2.9% to ¥22,061 million, operating profit fell 42.2% to ¥589 million, ordinary profit fell 41.8% to ¥563 million and profit attributable to owners of the parent fell 45.6% to ¥227 million, for earnings per share of ¥10.60 against ¥19.09. The shares are listed on the Tokyo Stock Exchange.
The arithmetic of the quarter is short. Net sales added ¥620 million, but cost of sales rose 5.0% to ¥6,024 million, so gross profit grew only 2.1% to ¥16,037 million and the gross margin slipped from 73.2% to 72.7%. Selling, general and administrative expenses — by far the larger cost line — rose 5.2%, or ¥764 million, to ¥15,447 million, absorbing 70.0% of sales against 68.5% a year earlier. That increase was more than twice the ¥333 million added to gross profit, so operating profit fell by ¥430 million and the operating margin dropped from 4.8% to 2.7%. The filing does not break SG&A down, but its description of the industry names rising purchasing costs and soaring labour costs.
Amortisation was not the cause. Goodwill amortisation was ¥433 million in both quarters — a large charge next to operating profit of ¥589 million, but an unchanged one — and depreciation eased to ¥745 million from ¥759 million.
Below the operating line, a property sale offset a head-office move
Non-operating items helped slightly. Non-operating income rose to ¥78 million from ¥73 million and non-operating expenses fell to ¥104 million from ¥125 million, mainly because interest expense dropped to ¥60 million from ¥77 million, so ordinary profit fell a little less than operating profit. Extraordinary items then added a net ¥76 million: a ¥145 million gain on the sale of fixed assets, with no such gain a year earlier, against losses of ¥69 million, of which ¥55 million was head-office relocation costs, ¥12 million losses on the retirement of fixed assets and ¥1 million impairment. A year earlier, extraordinary losses of ¥86 million had included ¥69 million of impairment on restaurants slated to close. Pre-tax profit was ¥639 million, down 27.5%.
Tax took most of what remained. Income taxes totalled ¥412 million, 64.5% of pre-tax profit against 52.6% a year earlier, with deferred-tax adjustments rising to ¥115 million from ¥52 million; the filing does not explain the higher charge. Profit attributable to owners of the parent fell 45.6% to ¥227 million. Earnings per share fell slightly less, 44.5% to ¥10.60, because the average number of shares outstanding dropped to 21,436,678 from 21,882,197.
Restaurants and cafés both sold more and earned less
The group reports two segments, and both followed the group pattern. Restaurant, the larger, grew sales 1.5% to ¥14,717 million while segment profit fell 14.6% to ¥776 million, narrowing its margin from 6.3% to 5.3%. Café grew sales faster, 4.3% to ¥7,239 million, but its profit fell further, 27.5% to ¥513 million, and its margin dropped from 10.2% to 7.1%. Together the two earned ¥1,290 million, down 20.3%, and corporate costs not allocated to segments rose to ¥608 million from ¥598 million. This year the adjustment column also carries ¥104 million of sales and ¥92 million of cost of sales from the company's own external sales of food materials, which is why group sales exceed the two segments' combined ¥21,957 million.
The supplementary purchasing figures show where the café margin went. Café purchases rose 7.6% to ¥1,626 million against café sales growth of 4.3%, while Restaurant purchases rose 1.8% to ¥4,315 million, broadly in line with its 1.5% sales growth. Sales at directly operated stores grew 1.4% in Restaurant and 4.3% in Café; royalty income, small at ¥73 million, rose 33.2%. The filing itself does not attribute either segment's profit decline to a particular cost.
What the company says it did
The filing describes an industry where inbound tourist demand is supporting spending, set against higher purchasing costs, more defensive household spending amid uncertainty over tension in the Middle East, and soaring labour costs. Under its medium-term plan the company says it opened and refurbished stores. In its pasta format it kept opening derivative formats, refurbishing stores and developing limited-time menus. In its café format it sought to raise profitability through price pass-through and rolled a renewed set menu out to stores nationwide to maintain and grow customer numbers. In its beef-cutlet set-meal business it kept opening stores in Japan and abroad while capturing inbound demand and pressing on with post-acquisition integration. The narrative's own summary of the quarter quotes net sales, ordinary profit and net profit, but not operating profit.
The group opened 10 directly operated stores and one franchised store in the quarter — three pasta restaurants, two bakery restaurants, a doria restaurant, a sushi restaurant, two beef-cutlet restaurants and a café, plus a franchised beef-cutlet store — and ended June with 871 stores: 817 directly operated and 54 franchised.
Cash fell as payables, taxes and borrowings were paid down
Total assets fell 4.8% from March 31, 2026 to ¥67,090 million. Cash and deposits dropped ¥2,248 million to ¥12,624 million and accounts receivable fell ¥956 million, while property, plant and equipment rose ¥475 million; goodwill fell ¥433 million and trademark rights ¥113 million through amortisation, leaving goodwill at ¥14,724 million. On the other side, accounts payable-other fell ¥782 million, income taxes payable ¥730 million, and long-term borrowings ¥1,025 million on repayment. Short-term borrowings, the current portion of long-term debt and long-term borrowings together stood at ¥19,529 million. No quarterly cash-flow statement was prepared.
Net assets fell 1.0% to ¥31,167 million, as retained earnings declined by ¥330 million despite the quarter's ¥227 million profit — consistent with payment of the ¥26.00 year-end dividend for FY3/2026. Because total assets shrank faster than equity, the equity ratio rose to 46.5% from 44.7%.
Guidance unchanged, and the first half asks a lot of the second quarter
The company left unchanged the forecast it published on May 13, 2026. For the first half to September 30, 2026 it expects net sales of ¥45,200 million (+3.7%), operating profit of ¥2,200 million (−6.9%), ordinary profit of ¥2,100 million (−6.7%) and profit attributable to owners of ¥1,000 million (−4.7%). For the full year to March 31, 2027 it expects net sales of ¥93,000 million (+5.2%), operating profit of ¥5,300 million (+2.9%), ordinary profit of ¥5,100 million (+0.8%) and profit attributable to owners of ¥2,900 million (+7.2%), for earnings per share of ¥135.28.
The first quarter delivered 48.8% of guided first-half sales but only 26.8% of guided first-half operating profit, leaving about ¥1,610 million of operating profit to be earned in July to September against ¥589 million in April to June. Against the full year, it delivered 23.7% of guided sales and 11.1% of guided operating profit. The filing does not say how that gap is expected to close. The dividend forecast is also unchanged, at ¥27.00 at the half-year and ¥27.00 at the year end, for an annual ¥54.00 against ¥52.00.
| Metric | Q1 FY3/2027 | Q1 FY3/2026 | Change |
|---|---|---|---|
| Net sales (¥ million) | 22,061 | 21,440 | +2.9% |
| Cost of sales (¥ million) | 6,024 | 5,737 | +5.0% |
| Gross profit (¥ million) | 16,037 | 15,703 | +2.1% |
| Gross margin | 72.7% | 73.2% | −0.5 pt |
| SG&A expenses (¥ million) | 15,447 | 14,682 | +5.2% |
| Operating profit (¥ million) | 589 | 1,020 | −42.2% |
| Operating margin | 2.7% | 4.8% | −2.1 pt |
| Ordinary profit (¥ million) | 563 | 969 | −41.8% |
| Extraordinary gains (¥ million) | 145 | 0 | new |
| Extraordinary losses (¥ million) | 69 | 86 | −19.8% |
| Pre-tax profit (¥ million) | 639 | 882 | −27.5% |
| Net profit attrib. to owners of parent (¥ million) | 227 | 417 | −45.6% |
| EPS (¥) | 10.60 | 19.09 | −44.5% |
| Restaurant — revenue (¥ million) | 14,717 | 14,497 | +1.5% |
| Restaurant — segment profit (¥ million) | 776 | 910 | −14.6% |
| Café — revenue (¥ million) | 7,239 | 6,943 | +4.3% |
| Café — segment profit (¥ million) | 513 | 709 | −27.5% |
| Cash and deposits (¥ million) | 12,624 | 14,872 | −15.1% |
| Total assets (¥ million) | 67,090 | 70,453 | −4.8% |
| Net assets (¥ million) | 31,167 | 31,488 | −1.0% |
| Equity ratio | 46.5% | 44.7% | +1.8 pt |
| H1 FY3/2027 guidance — revenue (¥ million) | 45,200 | — | +3.7% |
| H1 FY3/2027 guidance — operating profit (¥ million) | 2,200 | — | −6.9% |
| FY3/2027 guidance — revenue (¥ million) | 93,000 | — | +5.2% |
| FY3/2027 guidance — operating profit (¥ million) | 5,300 | — | +2.9% |
| FY3/2027 guidance — ordinary profit (¥ million) | 5,100 | — | +0.8% |
| FY3/2027 guidance — net profit (¥ million) | 2,900 | — | +7.2% |
| FY3/2027 guidance — EPS (¥) | 135.28 | — | n.m. |
| Annual dividend per share (¥) | 54.00 | 52.00 | +3.8% |
JapanStockPulse provides informational content only and does not constitute investment advice. Figures are taken from the company's published earnings short report and may be subject to subsequent revision.