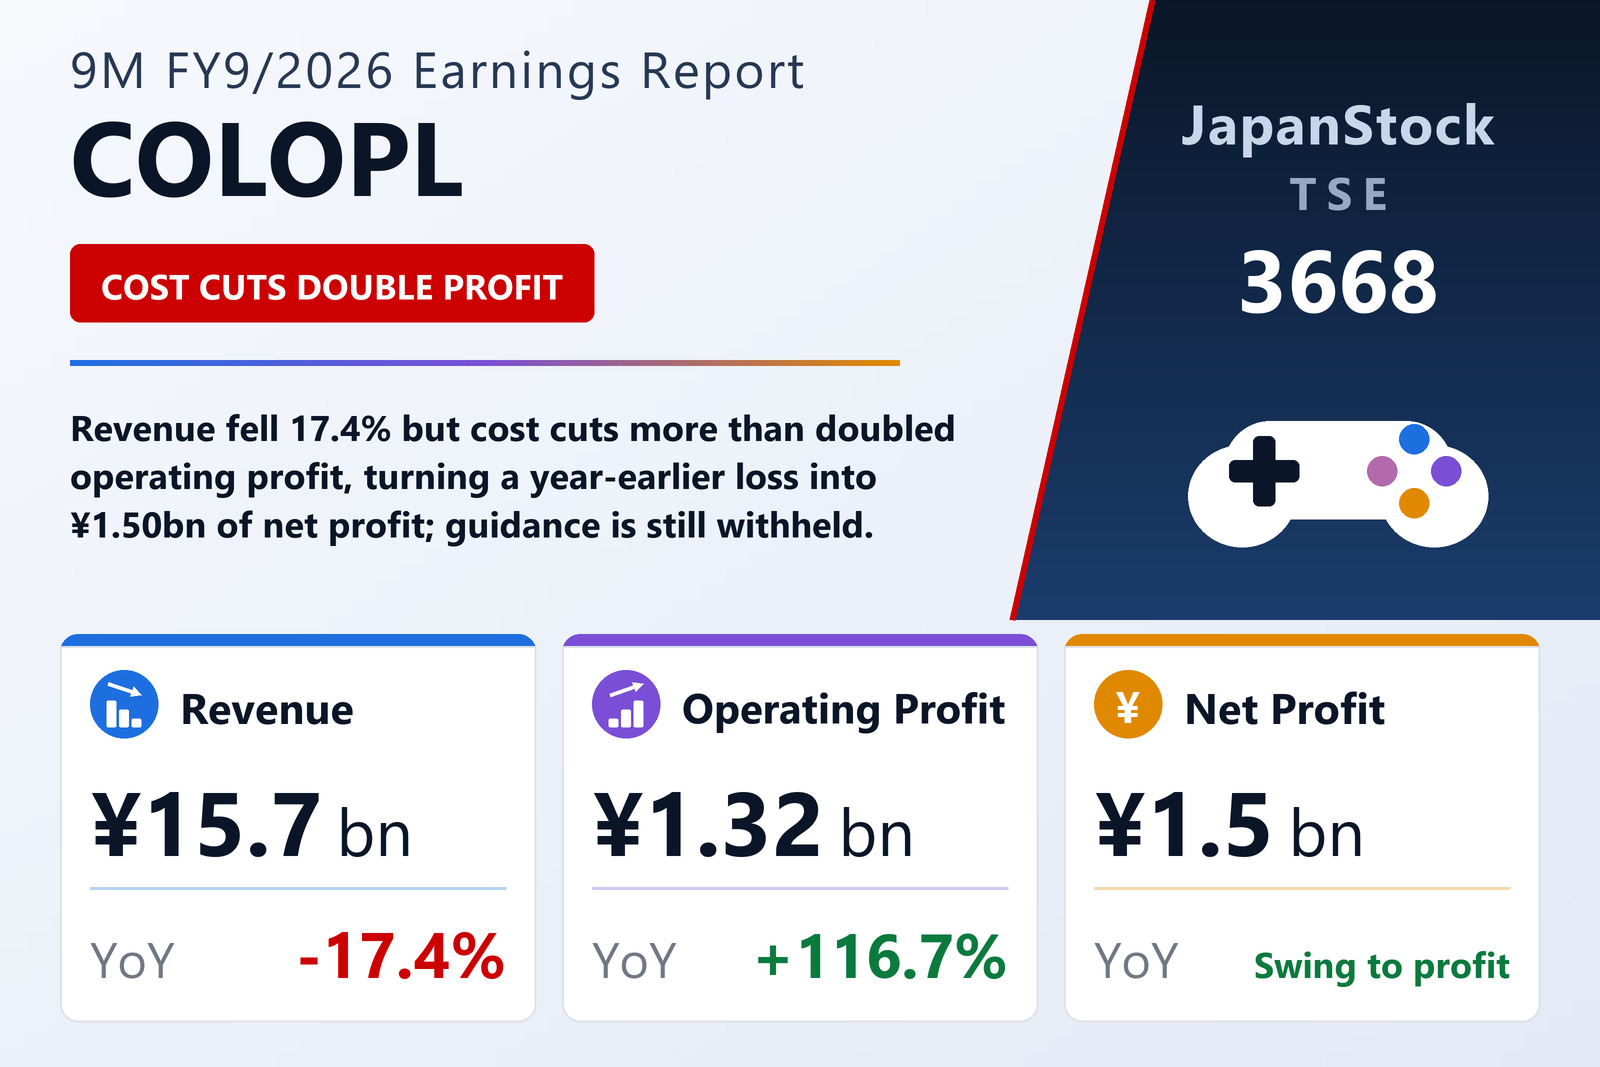
COLOPL, Inc. (TSE: 3668), the Tokyo-based mobile game developer behind Dragon Quest Walk, reported cumulative nine-month results for the first three quarters of the fiscal year ending September 30, 2026 — the period from October 1, 2025 to June 30, 2026 — under Japanese GAAP. Nine-month revenue fell 17.4% to ¥15,700 million from ¥18,998 million, but operating profit more than doubled, rising 116.7% to ¥1,320 million. Ordinary profit jumped 135.7% to ¥2,533 million, and net profit attributable to owners of the parent came in at ¥1,504 million — a swing from a net loss of ¥601 million in the same nine months a year earlier. Earnings per share were ¥11.70, against a loss per share of ¥4.68.
Less revenue, far more profit
The entertainment business, which develops and operates smartphone games, generated nine-month revenue of ¥14,676 million, down 12.9%, and swung to a segment profit of ¥1,109 million from an ¥825 million segment loss a year earlier. Dragon Quest Walk — planned and produced by Square Enix and developed by COLOPL — again anchored the group's consolidated results. Revenue at several existing titles tapered, however, and other titles ended service altogether, pulling the segment's top line lower. Offsetting that entirely, a group-wide cost review cut advertising and promotional spending, converting a loss-making nine months into a profitable one.
The investment arm gives back last year's windfall
The investment and incubation segment, which backs IT and entertainment companies in Japan and overseas, posted nine-month revenue of ¥1,023 million, down 52.2%, and segment profit of ¥209 million, down 85.4%. Funds in which the group holds stakes again booked income from the sale of operational investment securities, but the figure could not match a large transaction recorded in the prior-year period. The company also wrote down part of the operational investment securities it holds. Between the two segments, the entertainment business supplied 93% of nine-month revenue and 84% of pre-adjustment segment profit.
Why ordinary profit ran ¥1.2 billion above operating profit
Ordinary profit of ¥2,533 million sat ¥1,213 million above the operating line, an unusually wide gap. Non-operating income totalled ¥1,315 million, of which foreign-exchange gains of ¥796 million were by far the largest item, ahead of ¥363 million of interest income — a natural consequence of the group's very large cash balance — plus ¥91 million of gains on sales of investment securities and ¥64 million of miscellaneous income. Non-operating expenses were only ¥102 million. Below the ordinary line, COLOPL booked ¥66 million of gains on investment-securities sales as extraordinary income and a ¥273 million business-structure improvement charge as an extraordinary loss. The prior-year nine months, by contrast, carried a ¥1,449 million valuation loss on investment securities — the single item that pushed that period into the red.
Real Style removed from the consolidated group
COLOPL flagged a material change in the scope of consolidation during the nine months: Real Style Co., Ltd. was excluded from the consolidated group — one company removed, none added. The earnings release discloses the exclusion and the company name only. It does not quantify any gain or loss on the deconsolidation, does not state the mechanism, and records no note on significant changes in shareholders' equity. The ¥273 million business-structure improvement cost is the period's only restructuring-type charge, but the company does not link it to the deconsolidation.
A fortress balance sheet at 92.9% equity
Total assets stood at ¥72,248 million at June 30, 2026, down ¥3,493 million from ¥75,742 million at the September 30, 2025 year-end, with cash and deposits alone at ¥46,426 million — close to two-thirds of the balance sheet. Net assets were ¥67,107 million and shareholders' equity ¥67,103 million, lifting the equity ratio to 92.9% from 91.0%. Total liabilities fell ¥1,660 million to ¥5,141 million, leaving the group with almost no leverage. The dip in net assets reflects retained earnings paid out as dividends rather than operating weakness. Depreciation for the nine months was ¥224 million, up from ¥181 million; no consolidated cash-flow statement was prepared for the period.
No guidance, and the dividend is undetermined
COLOPL again declined to publish a full-year FY9/2026 forecast, stating that the business environment surrounding the group changes so rapidly in the short term that calculating appropriate and rational figures is difficult. On shareholder returns, the company paid ¥0.00 at the interim and ¥20.00 at the year-end of FY9/2025, for an annual total of ¥20.00; for FY9/2026 the year-end dividend forecast remains undetermined, with no revision to any previously announced forecast. Comprehensive income for the nine months was ¥688 million, down 86.0% from ¥4,934 million, as the securities valuation gains that inflated the prior-year figure reversed.
| Metric | 9M FY9/2026 | 9M FY9/2025 | YoY |
|---|---|---|---|
| Revenue | 15,700 | 18,998 | -17.4% |
| Operating profit | 1,320 | 609 | +116.7% |
| Ordinary profit | 2,533 | 1,074 | +135.7% |
| Net profit attrib. to owners | 1,504 | -601 | Swing to profit |
| Basic EPS (¥) | 11.70 | -4.68 | Swing to profit |
| Comprehensive income | 688 | 4,934 | -86.0% |
| Entertainment segment revenue | 14,676 | 16,856 | -12.9% |
| Entertainment segment profit | 1,109 | -825 | Swing to profit |
| Investment segment revenue | 1,023 | 2,142 | -52.2% |
| Investment segment profit | 209 | 1,432 | -85.4% |
| Total assets* | 72,248 | 75,742 | -4.6% |
| Equity ratio (%)* | 92.9 | 91.0 | +1.9 pt |
JapanStockPulse provides informational content only and does not constitute investment advice. Figures are taken from the company's published earnings short report and may be subject to subsequent revision.