Price revisions, and they reach everywhere
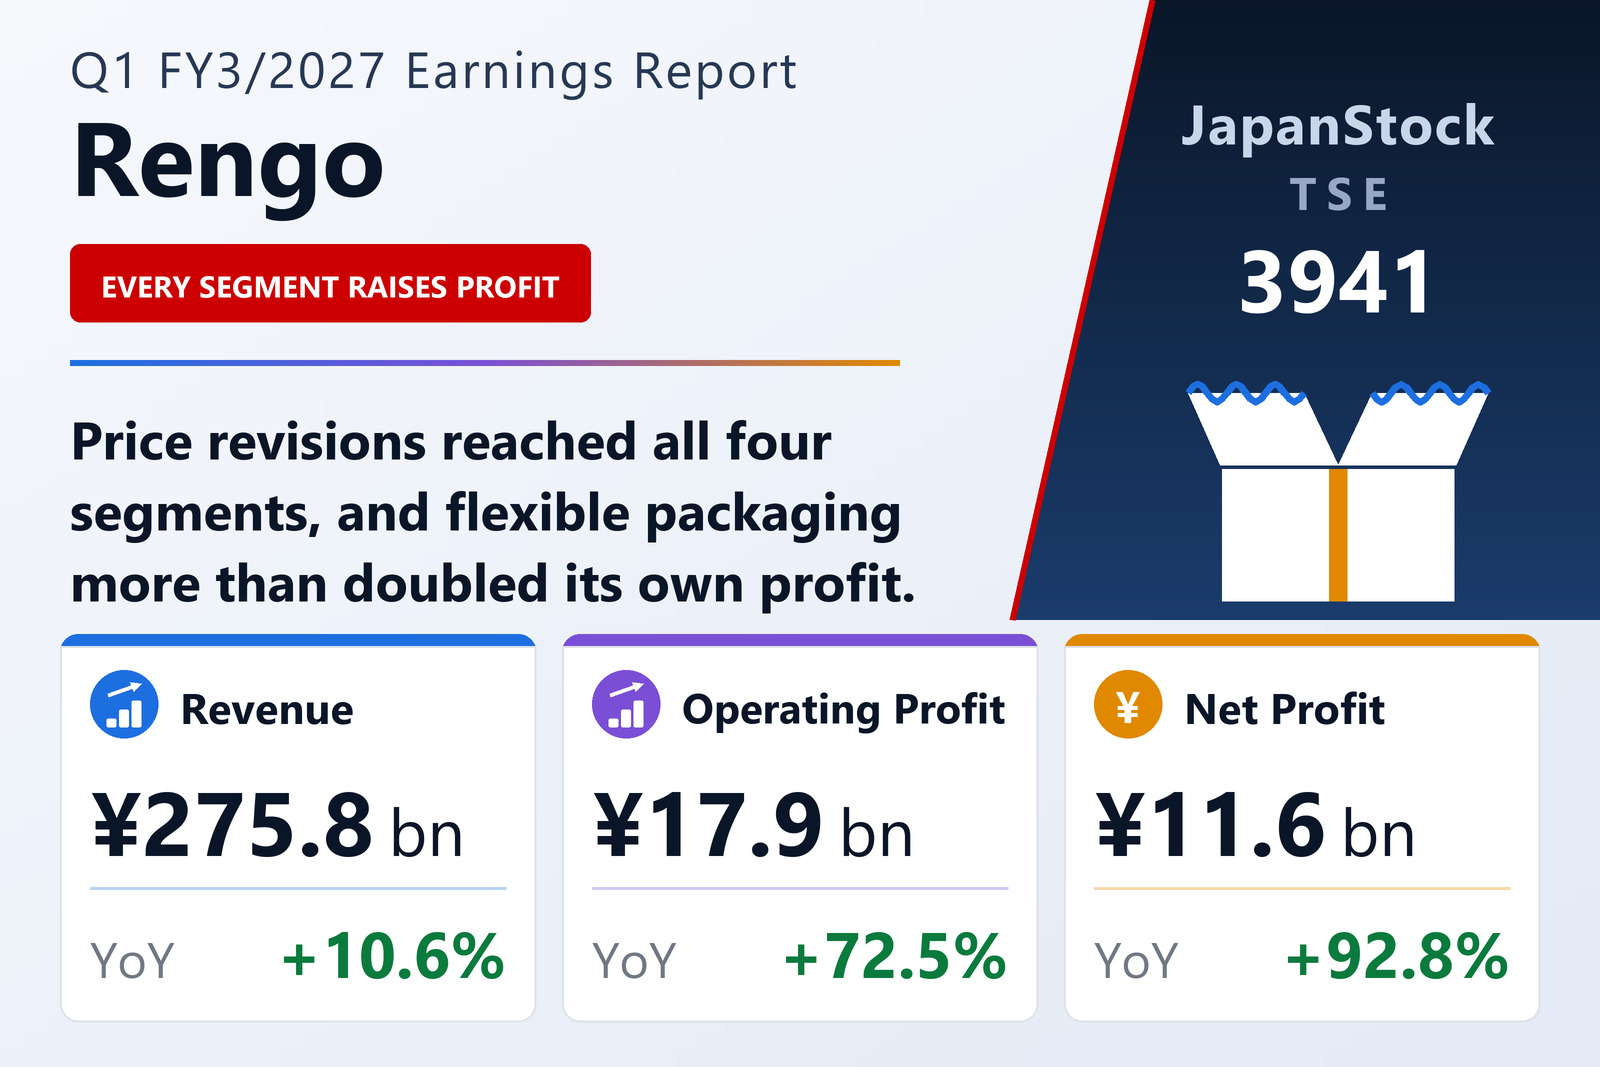
Rengo Co., Ltd. (TSE: 3941), Japan's largest corrugated packaging group, published consolidated results for the three months to June 30, 2026 on August 5, 2026 under Japanese GAAP. Net sales rose 10.6% to ¥275,750 million, operating profit 72.5% to ¥17,898 million, ordinary profit 80.3% to ¥18,903 million and net profit 92.8% to ¥11,575 million, for earnings per share of ¥46.97 against ¥24.22. Comprehensive income was ¥25,616 million against a ¥3,299 million loss.
The company gives price revisions as the driver, and states the counterweight in the same breath: the gains came despite increases in fixed costs and logistics expenses. The margin move — 6.5% against 4.2% — is what a price-led recovery looks like when volumes are broadly steady, and the fact that all four segments improved profit is what distinguishes it from a one-business rebound.
The four segments, in order of how much moved
Paperboard & Paper Processing, the core, grew external revenue 6.0% to ¥138,557 million and profit 46.7% to ¥10,137 million. Flexible Packaging was the standout on profit: revenue up 14.1% to ¥56,080 million and profit up 114.2% to ¥5,771 million. Alongside price revisions, the company notes that flexible and heavy-duty packaging both saw pull-forward demand as customers ordered ahead against uncertainty in the Middle East — a demand effect that by its nature borrows from later quarters.
Heavy-Duty Packaging grew revenue 13.7% to ¥12,903 million and profit 44.8% to ¥695 million. Overseas grew revenue 18.7% to ¥57,941 million and swung to a ¥699 million profit from a ¥109 million loss, helped by an increased number of consolidated subsidiaries and by strong heavy-duty packaging demand in North America and Southeast Asia.
Balance sheet grows with the business; guidance already 39% covered
Total assets rose 3.1% from the March year-end to ¥1,353,480 million and net assets 2.8% to ¥543,422 million, leaving the equity ratio essentially flat at 37.2% against 37.3%.
Guidance is unchanged: net sales of ¥1,090,000 million (+8.1%), operating profit of ¥46,000 million (+24.0%), ordinary profit of ¥44,000 million (+17.6%) and net profit of ¥31,000 million (+47.6%), for earnings per share of ¥125.78. The quarter has banked 38.9% of the full-year operating-profit target in three months, which leaves the forecast looking conservative on its face — though the pull-forward demand noted above is one reason the company may not want to extrapolate the run rate. The annual dividend rises 25.0% to ¥50.00 from ¥40.00, split ¥25.00 interim and ¥25.00 final.
| Metric | Q1 FY3/2027 | Q1 FY3/2026 | Change |
|---|---|---|---|
| Net sales (¥ million) | 275,750 | 249,399 | +10.6% |
| Operating profit (¥ million) | 17,898 | 10,375 | +72.5% |
| Operating margin | 6.5% | 4.2% | +2.3 pt |
| Ordinary profit (¥ million) | 18,903 | 10,483 | +80.3% |
| Net profit (¥ million) | 11,575 | 6,002 | +92.8% |
| EPS (¥) | 46.97 | 24.22 | +93.9% |
| Paperboard & Paper Processing — revenue (¥ million) | 138,557 | 130,730 | +6.0% |
| Paperboard & Paper Processing — segment profit (¥ million) | 10,137 | 6,911 | +46.7% |
| Flexible Packaging — revenue (¥ million) | 56,080 | 49,133 | +14.1% |
| Flexible Packaging — segment profit (¥ million) | 5,771 | 2,694 | +114.2% |
| Heavy-Duty Packaging — revenue (¥ million) | 12,903 | 11,348 | +13.7% |
| Heavy-Duty Packaging — segment profit (¥ million) | 695 | 480 | +44.8% |
| Overseas — revenue (¥ million) | 57,941 | 48,808 | +18.7% |
| Overseas — segment profit (¥ million) | 699 | −109 | loss to profit |
| Total assets (¥ million) | 1,353,480 | 1,313,086 | +3.1% |
| Net assets (¥ million) | 543,422 | 528,554 | +2.8% |
| Equity ratio | 37.2% | 37.3% | −0.1 pt |
| FY3/2027 guidance — revenue (¥ million) | 1,090,000 | — | +8.1% |
| FY3/2027 guidance — operating profit (¥ million) | 46,000 | — | +24.0% |
| FY3/2027 guidance — ordinary profit (¥ million) | 44,000 | — | +17.6% |
| FY3/2027 guidance — net profit (¥ million) | 31,000 | — | +47.6% |
| FY3/2027 guidance — EPS (¥) | 125.78 | — | n.m. |
| Annual dividend per share (¥) | 50.00 | 40.00 | +25.0% |
JapanStockPulse provides informational content only and does not constitute investment advice. Figures are taken from the company's published earnings short report and may be subject to subsequent revision.