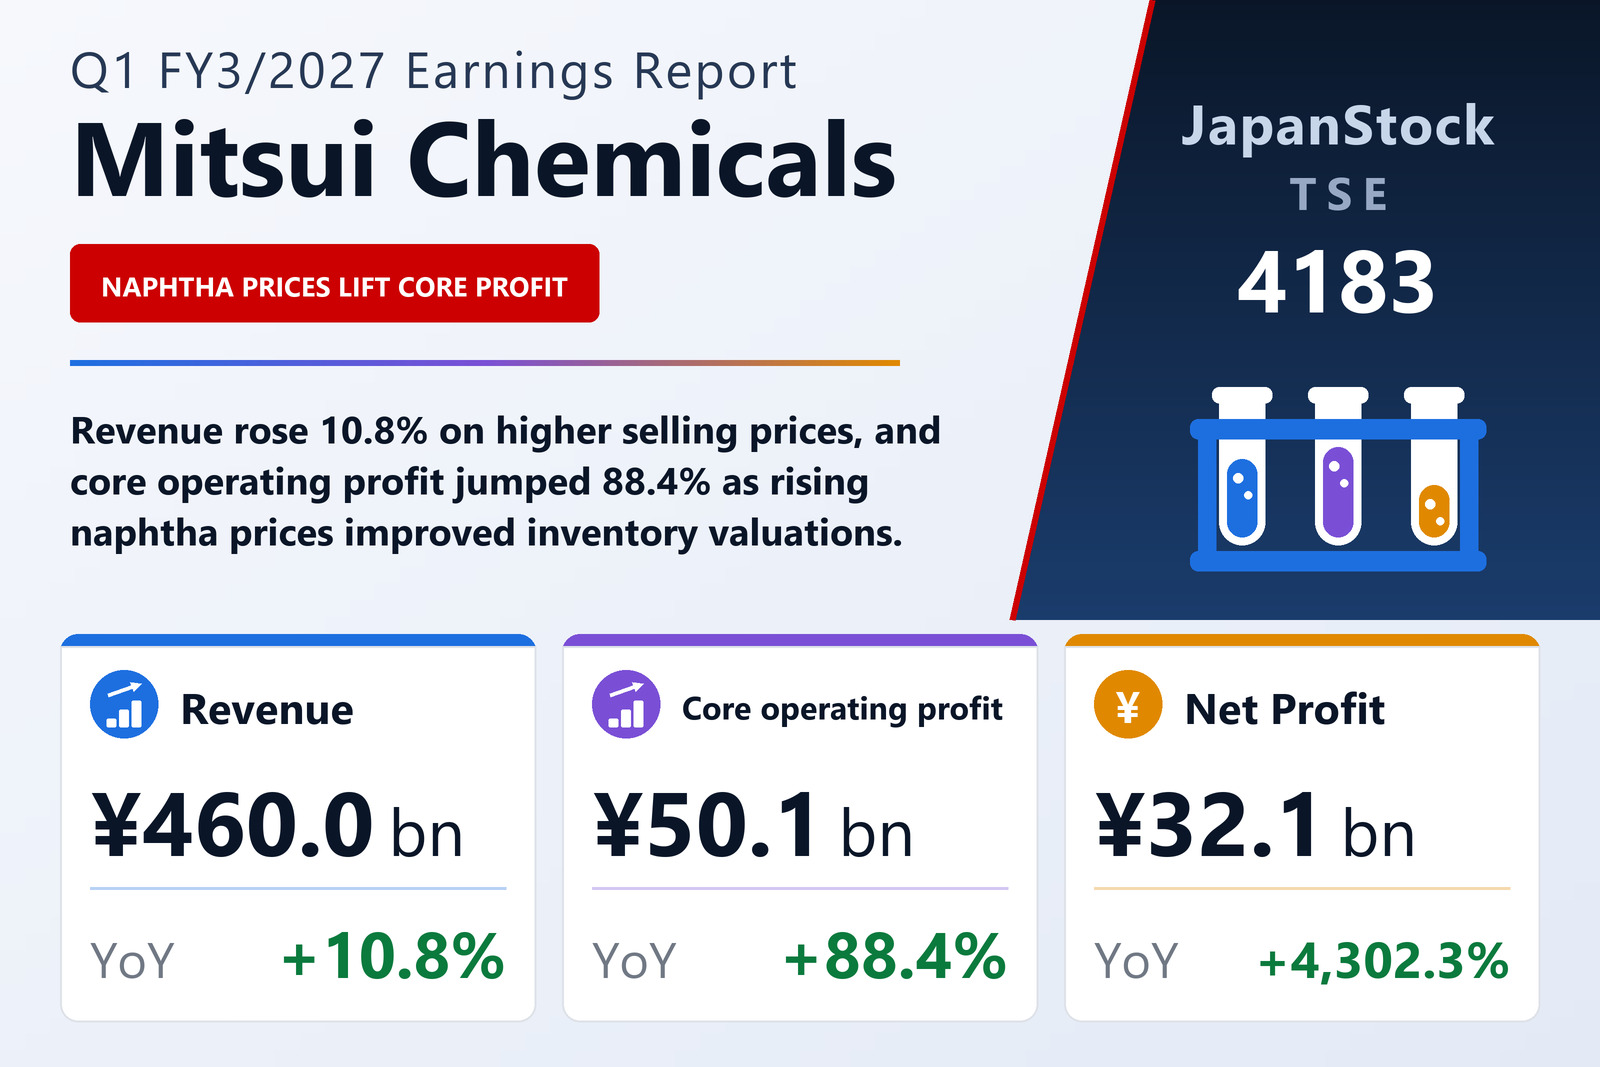
Higher prices lifted revenue; inventory valuation lifted profit
Mitsui Chemicals, Inc. (TSE: 4183), the chemical group whose segments range from vision-care and agrochemical materials to elastomers, semiconductor process materials and ethylene-based basic chemicals, published consolidated results for the first quarter of FY3/2027, the three months from April 1 to June 30, 2026, on August 5, 2026 under IFRS. Revenue rose 10.8% to ¥460,046 million, core operating profit 88.4% to ¥50,129 million, operating profit 279.8% to ¥48,432 million, pre-tax profit 379.3% to ¥47,708 million and profit attributable to owners of the parent to ¥32,093 million from ¥729 million. Basic earnings per share were ¥88.78 against ¥1.95; both figures are calculated as if the 2-for-1 stock split of January 1, 2026 had taken place at the start of FY3/2026. The shares are listed on the Tokyo Stock Exchange.
The company attributes the revenue gain to higher selling prices that followed rising naphtha and other feedstock costs, and to currency effects. Its supplementary tables split the ¥44.6 billion increase into a price effect of +¥61.0 billion and a volume effect of −¥16.4 billion. The domestic naphtha price used in those tables was ¥118,900 per kilolitre for the quarter against ¥66,400 a year earlier, and the yen stood at ¥159 to the dollar against ¥145. Cost of sales rose only 6.8% to ¥343,591 million, so gross profit climbed 24.3% to ¥116,455 million and the gross margin widened from 22.6% to 25.3%. Selling, general and administrative expenses rose 3.3% to ¥73,391 million.
The filing gives one main cause for the jump in core operating profit: better inventory valuation gains and losses as naphtha prices rose. The supplementary bridge puts almost all of the ¥23.5 billion increase in terms of trade, +¥22.9 billion, with volume and fixed costs adding ¥0.3 billion each. Core operating profit, which Mitsui Chemicals calculates by removing non-recurring items such as losses from business withdrawals and downsizing from operating profit, includes equity-method income, which rose to ¥6,948 million from ¥4,361 million. The core operating margin widened from 6.4% to 10.9%.
Smaller impairments carried reported profit further
Reported operating profit rose much faster than core operating profit because the prior-year quarter carried heavy non-recurring charges. The reconciliation in the segment note shows impairment losses of ¥1,399 million against ¥12,390 million, losses on disposal of fixed assets of ¥536 million against ¥470 million, business-related losses of ¥38 million against ¥891 million and other items of +¥276 million against −¥110 million, so non-recurring items netted to −¥1,697 million this year against −¥13,861 million. Other operating expenses fell to ¥2,335 million from ¥14,861 million. Net finance costs narrowed to ¥724 million from ¥2,800 million, as finance income rose to ¥2,568 million and finance costs fell to ¥3,292 million.
Income tax expense rose to ¥10,449 million from ¥4,275 million, an effective rate of about 21.9% against 43.0%, leaving quarterly profit of ¥37,259 million, up 556.2%. Non-controlling interests took ¥5,166 million of that (¥4,949 million a year earlier), so profit attributable to owners of the parent came to ¥32,093 million, an increase the company puts at 4,302.3% and one that mostly reflects how small the prior-year base of ¥729 million was. Comprehensive income was ¥40,372 million against a negative ¥244 million, with foreign-currency translation differences of +¥5,918 million replacing −¥6,230 million.
Basic & Green Materials swung by ¥22.7 billion
Segment revenue figures here are sales to external customers, and segment profit is core operating profit. Basic & Green Materials, the largest segment at 38% of revenue, did most of the work: revenue rose 11.2% to ¥173,609 million and core operating profit swung to ¥19,842 million from a loss of ¥2,886 million. Sales were weak, and the naphtha cracker ran at a low operating rate because of production adjustments linked to instability in the Middle East, but inventory valuation improved as naphtha prices rose, restructuring lowered fixed costs and equity-method income increased. Phenols sold less than a year earlier but with lower fixed costs, and polyolefin sales were flat.
The three growth segments together added ¥2.9 billion of core operating profit. Mobility Solutions (31% of revenue) grew revenue 9.5% to ¥142,568 million but core operating profit only 1.6% to ¥14,778 million: lower sales linked to the Middle East situation and higher depreciation from elastomer capacity expansion were offset mainly by currency-driven terms of trade. ICT Solutions (17%) grew revenue 12.7% to ¥77,774 million and core operating profit 22.7% to ¥11,097 million on firm sales of semiconductor and optical materials and ICT films and sheets, plus currency-driven terms of trade. Life & Healthcare Solutions (13%) grew revenue 10.5% to ¥62,181 million and core operating profit 9.2% to ¥6,757 million on firm vision-care and agrochemical sales, while oral care was flat but cut fixed costs through restructuring. The Other category's core operating loss narrowed to ¥3 million from ¥173 million.
Working capital absorbed cash, and borrowing funded a buyback
Operating cash flow fell to ¥14,037 million from ¥45,438 million, which the company attributes mainly to higher working capital: inventories absorbed ¥50,906 million and trade receivables ¥20,313 million, only partly offset by a ¥41,606 million rise in trade payables. Investing activities used ¥29,238 million, including ¥26,439 million for property, plant and equipment, leaving free cash flow of −¥15,201 million. Financing activities brought in ¥47,088 million against an outflow of ¥8,760 million a year earlier, as commercial paper rose by ¥52,000 million and short-term borrowings by ¥50,268 million, while ¥15,000 million of bonds were redeemed, ¥13,804 million was paid in dividends and ¥12,781 million was spent on share buybacks.
Total assets rose 5.1% to ¥2,262,306 million from March 31, 2026. Interest-bearing debt rose ¥80.6 billion to ¥876.4 billion, lifting its ratio to total assets by 1.7 points to 38.7%, and the net debt-to-equity ratio rose by 0.05 to 0.75. Equity attributable to owners of the parent grew only 1.0% to ¥873,247 million, so the parent equity ratio fell from 40.2% to 38.6%. Cash and cash equivalents ended the quarter at ¥217,840 million, up ¥34,727 million, and treasury shares rose to 40,194,231 from 33,588,357.
First-half guidance disclosed, full-year guidance unchanged
Mitsui Chemicals had previously left its first-half forecast undetermined and now discloses one: revenue of ¥957,000 million (+17.6%), core operating profit of ¥76,000 million (+71.0%), operating profit of ¥66,000 million (+136.2%) and profit attributable to owners of the parent of ¥34,000 million (+333.5%), assuming ¥160 to the dollar and a domestic naphtha price of ¥104,500 per kilolitre. The first quarter alone delivered 66.0% of that core operating profit on 48.1% of the revenue, which implies about ¥25,871 million of core operating profit in the second quarter against ¥50,129 million in the first. The naphtha assumption is below the first quarter's ¥118,900, but the filing does not say how that bears on the inventory valuation gains that drove the quarter.
Full-year FY3/2027 guidance was not changed: revenue of ¥1,900,000 million (+13.9%), core operating profit of ¥105,000 million (+5.0%), operating profit of ¥83,000 million (+12.5%) and profit attributable to owners of the parent of ¥45,000 million (+30.9%), for earnings per share of ¥124.48. The first quarter's core operating profit already equals 47.7% of the full-year figure. The dividend forecast is also unchanged at ¥37.50 at the interim and ¥37.50 at the year-end, ¥75.00 in total, the same as FY3/2026's split-adjusted ¥75.00.
Sumitomo Chemical's domestic polypropylene and LLDPE businesses joined Prime Polymer
After the quarter closed, Prime Polymer Co., Ltd., a consolidated subsidiary set up in 2005 as a joint venture of Mitsui Chemicals and Idemitsu Kosan, began integrating Sumitomo Chemical's domestic polypropylene and linear low-density polyethylene businesses on July 1, 2026. The transfer runs through two absorption-type company splits. The first, effective July 1, 2026, moved the businesses other than manufacturing in exchange for a 20% stake, leaving Prime Polymer owned 52% by Mitsui Chemicals, 28% by Idemitsu Kosan and 20% by Sumitomo Chemical; the second, covering the manufacturing assets and liabilities, is scheduled for April 1, 2027. The three companies aim for rationalisation of at least ¥8.0 billion a year. The initial accounting under IFRS 3 was not complete when the statements were approved, so the filing gives no figures for the consideration, the assets acquired or goodwill.
| Metric | Q1 FY3/2027 | Q1 FY3/2026 | Change |
|---|---|---|---|
| Revenue (¥ million) | 460,046 | 415,350 | +10.8% |
| Gross profit (¥ million) | 116,455 | 93,724 | +24.3% |
| Gross margin | 25.3% | 22.6% | +2.7 pt |
| SG&A expenses (¥ million) | 73,391 | 71,015 | +3.3% |
| Core operating profit (¥ million) | 50,129 | 26,614 | +88.4% |
| Operating profit (¥ million) | 48,432 | 12,753 | +279.8% |
| Pre-tax profit (¥ million) | 47,708 | 9,953 | +379.3% |
| Net profit (¥ million) | 37,259 | 5,678 | +556.2% |
| Net profit attrib. to owners of parent (¥ million) | 32,093 | 729 | +4,302.3% |
| Comprehensive income (¥ million) | 40,372 | -244 | loss to profit |
| EPS (¥) | 88.78 | 1.95 | +4,452.8% |
| Life & Healthcare Solutions — revenue (¥ million) | 62,181 | 56,251 | +10.5% |
| Life & Healthcare Solutions — core operating profit (¥ million) | 6,757 | 6,190 | +9.2% |
| Mobility Solutions — revenue (¥ million) | 142,568 | 130,219 | +9.5% |
| Mobility Solutions — core operating profit (¥ million) | 14,778 | 14,550 | +1.6% |
| ICT Solutions — revenue (¥ million) | 77,774 | 69,012 | +12.7% |
| ICT Solutions — core operating profit (¥ million) | 11,097 | 9,046 | +22.7% |
| Basic & Green Materials — revenue (¥ million) | 173,609 | 156,159 | +11.2% |
| Basic & Green Materials — core operating profit (¥ million) | 19,842 | -2,886 | loss to profit |
| Other — revenue (¥ million) | 3,914 | 3,709 | +5.5% |
| Other — core operating profit (¥ million) | -3 | -173 | loss narrowed |
| Total assets (¥ million) | 2,262,306 | 2,151,652 | +5.1% |
| Shareholders' equity (¥ million) | 997,585 | 988,784 | +0.9% |
| Equity attrib. to owners of parent (¥ million) | 873,247 | 864,727 | +1.0% |
| Equity ratio | 38.6% | 40.2% | −1.6 pt |
| FY3/2027 guidance — revenue (¥ million) | 1,900,000 | — | +13.9% |
| FY3/2027 guidance — core operating profit (¥ million) | 105,000 | — | +5.0% |
| FY3/2027 guidance — operating profit (¥ million) | 83,000 | — | +12.5% |
| FY3/2027 guidance — net profit attrib. to owners of parent (¥ million) | 45,000 | — | +30.9% |
| FY3/2027 guidance — EPS (¥) | 124.48 | — | — |
| Annual dividend per share (¥) | 75.00 | 75.00 | unchanged |
JapanStockPulse provides informational content only and does not constitute investment advice. Figures are taken from the company's published earnings short report and may be subject to subsequent revision.