Two directions in one set of accounts
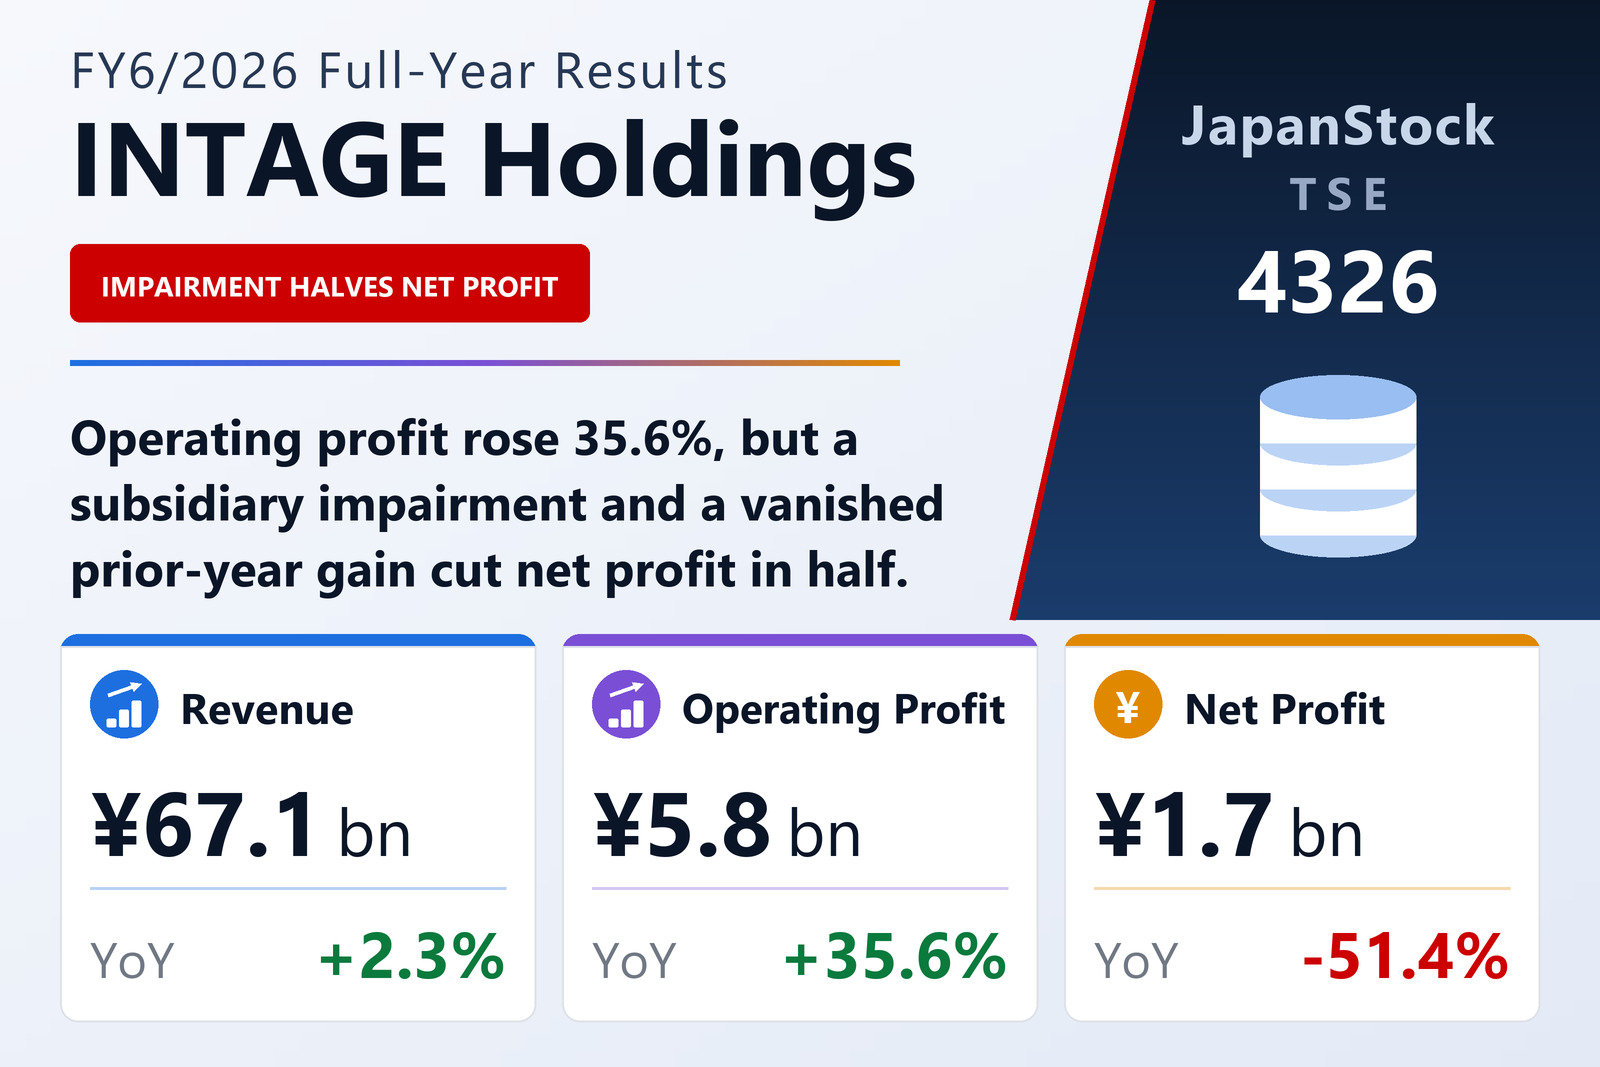
INTAGE HOLDINGS Inc. (TSE: 4326), Japan's largest market-research group, published consolidated results for the year to June 30, 2026 on August 5, 2026 under Japanese GAAP. Net sales rose 2.3% to ¥67,099 million, operating profit 35.6% to ¥5,752 million and ordinary profit 39.3% to ¥5,753 million. Net profit went the other way, down 51.4% to ¥1,703 million, for earnings per share of ¥44.58 against ¥91.83.
The divergence is entirely below the operating line and is the product of two extraordinary items moving in opposite directions. The company recognised an impairment loss on the goodwill and other fixed assets of consolidated subsidiary Research and Innovation Inc., taking extraordinary losses to ¥1,782 million against ¥700 million. At the same time the prior year had carried ¥1,828 million of extraordinary income against just ¥29 million this year. The two together are a swing of roughly ¥3.3 billion, which is what turns a 35.6% operating gain into a 51.4% net decline. Return on equity fell to 5.1% from 10.7%.
The operating gain is real, and it is broad-based in two of three segments
Marketing Support (Consumer Goods & Services), the largest business, grew revenue 4.0% to ¥47,149 million and profit 69.6% to ¥2,434 million. Marketing Support (Healthcare) grew revenue 1.3% to ¥12,594 million and profit 25.8% to ¥2,684 million — a smaller business than the first but a more profitable one, contributing more segment profit on a quarter of the revenue. Business Intelligence was the exception, with revenue down 5.6% to ¥7,357 million and profit down 5.4% to ¥636 million.
This is the final year of the group's 14th mid-term management plan, "Growth with Optimization". Alongside the plan it cites a business partnership with NTT Docomo and a push to change its own processes with generative AI. Within the numbers, subsidiary INTAGE Research declined against a large prior-year project that did not repeat — a reminder that a research business carries lumpiness at the project level.
Cash flow, and a dividend that exceeded earnings
Total assets rose 2.2% to ¥47,968 million and net assets 2.6% to ¥34,197 million, taking the equity ratio to 70.9% from 70.6% — an unusually strong balance sheet for the sector. Operating cash flow was ¥4,075 million against ¥6,429 million, investing cash flow −¥1,410 million against a positive ¥910 million, and financing cash flow −¥2,026 million, leaving cash and equivalents of ¥17,336 million.
The dividend deserves its own note. The annual payout rises to ¥48.00 from ¥45.00, but with net profit at ¥1,703 million and total dividends of ¥1,848 million, the payout ratio is 107.7% — the company distributed more than it earned. It frames the policy on a dividend-on-equity basis at 5.5%, which is what allows a payout to be maintained through an impairment year. Guidance for FY6/2027 is net sales of ¥71,000 million (+5.8%), operating profit of ¥6,200 million (+7.8%), ordinary profit of ¥6,250 million (+8.6%) and net profit of ¥4,000 million (+134.9% — the rebound from this year's impairment), for earnings per share of ¥104.68. The forecast dividend of ¥50.00 would be a payout ratio of 47.8%, back inside a normal range.
| Metric | FY6/2026 | FY6/2025 | Change |
|---|---|---|---|
| Net sales (¥ million) | 67,099 | 65,571 | +2.3% |
| Operating profit (¥ million) | 5,752 | 4,241 | +35.6% |
| Operating margin | 8.6% | 6.5% | +2.1 pt |
| Ordinary profit (¥ million) | 5,753 | 4,131 | +39.3% |
| Net profit (¥ million) | 1,703 | 3,505 | −51.4% |
| EPS (¥) | 44.58 | 91.83 | −51.5% |
| Marketing Support (Consumer Goods & Services) — revenue (¥ million) | 47,149 | 45,344 | +4.0% |
| Marketing Support (Consumer Goods & Services) — segment profit (¥ million) | 2,434 | 1,435 | +69.6% |
| Marketing Support (Healthcare) — revenue (¥ million) | 12,594 | 12,432 | +1.3% |
| Marketing Support (Healthcare) — segment profit (¥ million) | 2,684 | 2,134 | +25.8% |
| Business Intelligence — revenue (¥ million) | 7,357 | 7,795 | −5.6% |
| Business Intelligence — segment profit (¥ million) | 636 | 672 | −5.4% |
| Total assets (¥ million) | 47,968 | 46,922 | +2.2% |
| Net assets (¥ million) | 34,197 | 33,321 | +2.6% |
| Equity ratio | 70.9% | 70.6% | +0.3 pt |
| FY6/2027 guidance — revenue (¥ million) | 71,000 | — | +5.8% |
| FY6/2027 guidance — operating profit (¥ million) | 6,200 | — | +7.8% |
| FY6/2027 guidance — ordinary profit (¥ million) | 6,250 | — | +8.6% |
| FY6/2027 guidance — net profit (¥ million) | 4,000 | — | +134.9% |
| FY6/2027 guidance — EPS (¥) | 104.68 | — | n.m. |
| Annual dividend per share (¥) | 48.00 | 45.00 | +6.7% |
JapanStockPulse provides informational content only and does not constitute investment advice. Figures are taken from the company's published earnings short report and may be subject to subsequent revision.