Sales up 23%, gross profit down 3% — the defense contract explains the gap
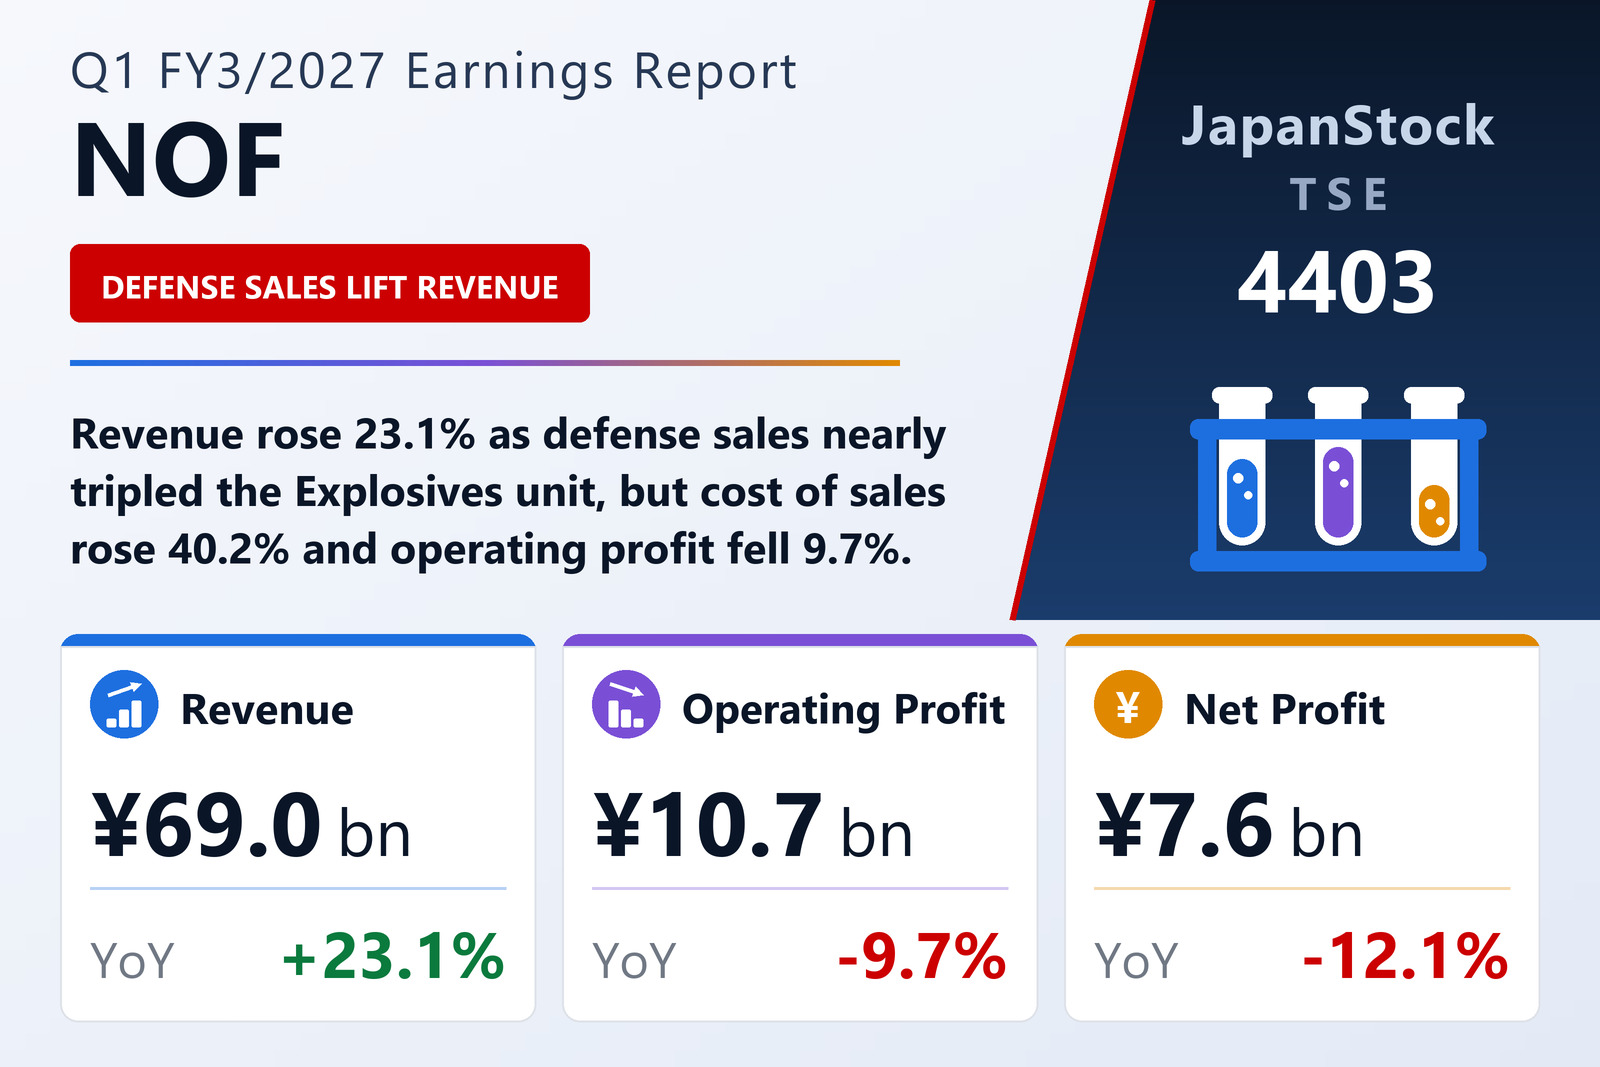
NOF Corporation (TSE: 4403), the chemicals group whose businesses span functional chemicals, pharmaceutical and health materials and explosives, published consolidated first-quarter results for the three months from April 1 to June 30, 2026 on August 5, 2026 under Japanese GAAP. Revenue rose 23.1% to ¥69,007 million, but operating profit fell 9.7% to ¥10,695 million, ordinary profit 6.3% to ¥11,505 million and profit attributable to owners of the parent 12.1% to ¥7,571 million, for earnings of ¥33.53 per share against ¥37.00. The shares are listed on the Tokyo Stock Exchange.
The gap between the top line and the profit lines opens at cost of sales, which rose 40.2% to ¥47,508 million — far faster than revenue. Gross profit therefore fell 3.0% to ¥21,498 million and the gross margin narrowed from 39.5% to 31.2%. The filing's additional-information note gives the mechanism: part of the Explosives segment's defense-related transactions for early deployment is recognized over time as the performance obligation is satisfied, and the costs matched against that revenue include amounts for acquiring fixed assets, which are booked as cost of sales. Depreciation for the quarter, which the filing says includes the expensing of that defense-equipment investment, was ¥10,323 million against ¥2,001 million. Selling, general and administrative expenses grew only 4.6% to ¥10,803 million, but with gross profit lower the operating margin fell from 21.1% to 15.5%.
Below the operating line, a currency swing softened the decline
Ordinary profit fell less than operating profit because non-operating items moved in the company's favor: a foreign-exchange gain of ¥169 million replaced a loss of ¥195 million a year earlier, non-operating income rose to ¥976 million from ¥798 million, and non-operating expenses fell to ¥166 million from ¥370 million. Extraordinary items were small — gains of ¥36 million and losses of ¥79 million — leaving pre-tax profit of ¥11,463 million, down 6.3%. Income taxes rose to ¥3,862 million from ¥3,624 million, so net profit for the quarter fell 11.7% to ¥7,600 million, of which ¥29 million went to non-controlling interests. Comprehensive income was ¥10,562 million, down 7.1%, supported by a ¥2,780 million increase in unrealized gains on securities.
Explosives nearly tripled while pharmaceutical profit fell by three quarters
Functional Chemicals, the largest segment, grew sales 8.8% to ¥39,177 million and segment profit 11.0% to ¥7,852 million. The filing cites firm environment- and energy-related demand for fatty-acid derivatives together with price revisions made in response to higher raw-material and fuel costs, strong toiletry demand for surfactants, and good shipments of ethylene-oxide and propylene-oxide derivatives. Organic peroxides declined on weak demand in Japan and Asia, and specialty anti-corrosion treatments on weak overseas automotive demand.
Explosives sales rose 197.8% to ¥18,411 million, and the segment swung to a profit of ¥2,296 million from a loss of ¥7 million. Defense-related products grew as revenue was recognized on part of the transactions covering initial costs for early deployment, while industrial explosives declined and space products fell on lower shipments for rockets. Pharmaceuticals, Medical & Health went the other way: sales fell 17.9% to ¥11,244 million and segment profit 77.6% to ¥1,223 million, because the company expects most shipments of DDS (drug delivery system) pharmaceutical raw materials in the second half. MPC-based biocompatible materials and health products grew, and edible processed oils were flat. The segment's sales outside Japan, Asia and Europe fell to ¥1,671 million from ¥5,296 million. The Other businesses, transport and real estate, posted sales of ¥174 million and profit of ¥163 million. All segment sales cited here are to external customers.
Cash fell as taxes, dividends and buybacks were paid
Total assets fell 4.2% to ¥382,306 million from ¥399,168 million at March 31, 2026. Cash and deposits dropped by ¥23,517 million to ¥64,846 million and trade receivables by ¥5,573 million, while inventories rose by ¥5,642 million and investment securities by ¥4,091 million. Liabilities fell by ¥14,741 million to ¥87,961 million, chiefly because income taxes payable dropped by ¥10,628 million as taxes were paid. Net assets slipped 0.7% to ¥294,345 million: quarterly profit of ¥7,571 million and a ¥2,779 million rise in unrealized gains on securities were outweighed by dividends of ¥7,929 million and treasury-share purchases of ¥4,686 million. With assets shrinking faster than equity, the equity ratio rose from 74.0% to 76.7%. Research and development spending in the quarter was ¥2,266 million and capital expenditure ¥9,434 million.
Guidance held, with pharmaceutical shipments weighted to the second half
NOF left its full-year FY3/2027 guidance, first published on May 11, 2026, unchanged: revenue of ¥319,000 million (+23.7%), operating profit of ¥50,000 million (+5.5%), ordinary profit of ¥51,000 million (+1.3%) and profit attributable to owners of ¥39,000 million (−3.8%), or ¥169.60 per share. The first quarter delivered 21.6% of guided revenue, 21.4% of guided operating profit and 19.4% of guided net profit. The company says the second-half weighting of DDS raw-material shipments was already built into the original plan and that demand remains firm; that work on the defense transactions is progressing smoothly, with revenue recognition expected as planned; and that the supply-chain impact of the Middle East situation on Functional Chemicals should be milder than first assumed, although it continues to watch raw-material and fuel prices.
The dividend forecast was not revised: ¥35.00 at the interim and ¥35.00 at the year-end, for ¥70.00 against ¥61.00, up 14.8%. On August 5, 2026, the day of the filing, the board also approved a buyback of up to 2,000,000 shares or ¥5,000 million through market purchases on the Tokyo Stock Exchange between August 6 and September 30, 2026, and the cancellation of 10,000,000 treasury shares on September 30, 2026, which will leave 226,524,128 shares issued. The filing links the move to its medium-term plan NOF VISION 2030 Stage III, which sets a total shareholder return ratio of 70% or more as a guide.
| Metric | Q1 FY3/2027 | Q1 FY3/2026 | Change |
|---|---|---|---|
| Revenue (¥ million) | 69,007 | 56,063 | +23.1% |
| Gross profit (¥ million) | 21,498 | 22,171 | −3.0% |
| Gross margin | 31.2% | 39.5% | −8.3 pt |
| SG&A expenses (¥ million) | 10,803 | 10,324 | +4.6% |
| Operating profit (¥ million) | 10,695 | 11,847 | −9.7% |
| Operating margin | 15.5% | 21.1% | −5.6 pt |
| Ordinary profit (¥ million) | 11,505 | 12,274 | −6.3% |
| Net profit attrib. to owners of parent (¥ million) | 7,571 | 8,610 | −12.1% |
| Comprehensive income (¥ million) | 10,562 | 11,368 | −7.1% |
| EPS (¥) | 33.53 | 37.00 | −9.4% |
| Functional Chemicals — revenue (¥ million) | 39,177 | 36,020 | +8.8% |
| Functional Chemicals — segment profit (¥ million) | 7,852 | 7,073 | +11.0% |
| Pharmaceuticals, Medical & Health — revenue (¥ million) | 11,244 | 13,689 | −17.9% |
| Pharmaceuticals, Medical & Health — segment profit (¥ million) | 1,223 | 5,459 | −77.6% |
| Explosives — revenue (¥ million) | 18,411 | 6,183 | +197.8% |
| Explosives — segment profit (¥ million) | 2,296 | −7 | loss to profit |
| Other — revenue (¥ million) | 174 | 171 | +1.6% |
| Other — segment profit (¥ million) | 163 | 166 | −1.4% |
| Total assets (¥ million) | 382,306 | 399,168 | −4.2% |
| Net assets (¥ million) | 294,345 | 296,465 | −0.7% |
| Equity ratio | 76.7% | 74.0% | +2.7 pt |
| FY3/2027 guidance — revenue (¥ million) | 319,000 | — | +23.7% |
| FY3/2027 guidance — operating profit (¥ million) | 50,000 | — | +5.5% |
| FY3/2027 guidance — ordinary profit (¥ million) | 51,000 | — | +1.3% |
| FY3/2027 guidance — net profit (¥ million) | 39,000 | — | −3.8% |
| FY3/2027 guidance — EPS (¥) | 169.60 | — | — |
| Annual dividend per share (¥) | 70.00 | 61.00 | +14.8% |
JapanStockPulse provides informational content only and does not constitute investment advice. Figures are taken from the company's published earnings short report and may be subject to subsequent revision.