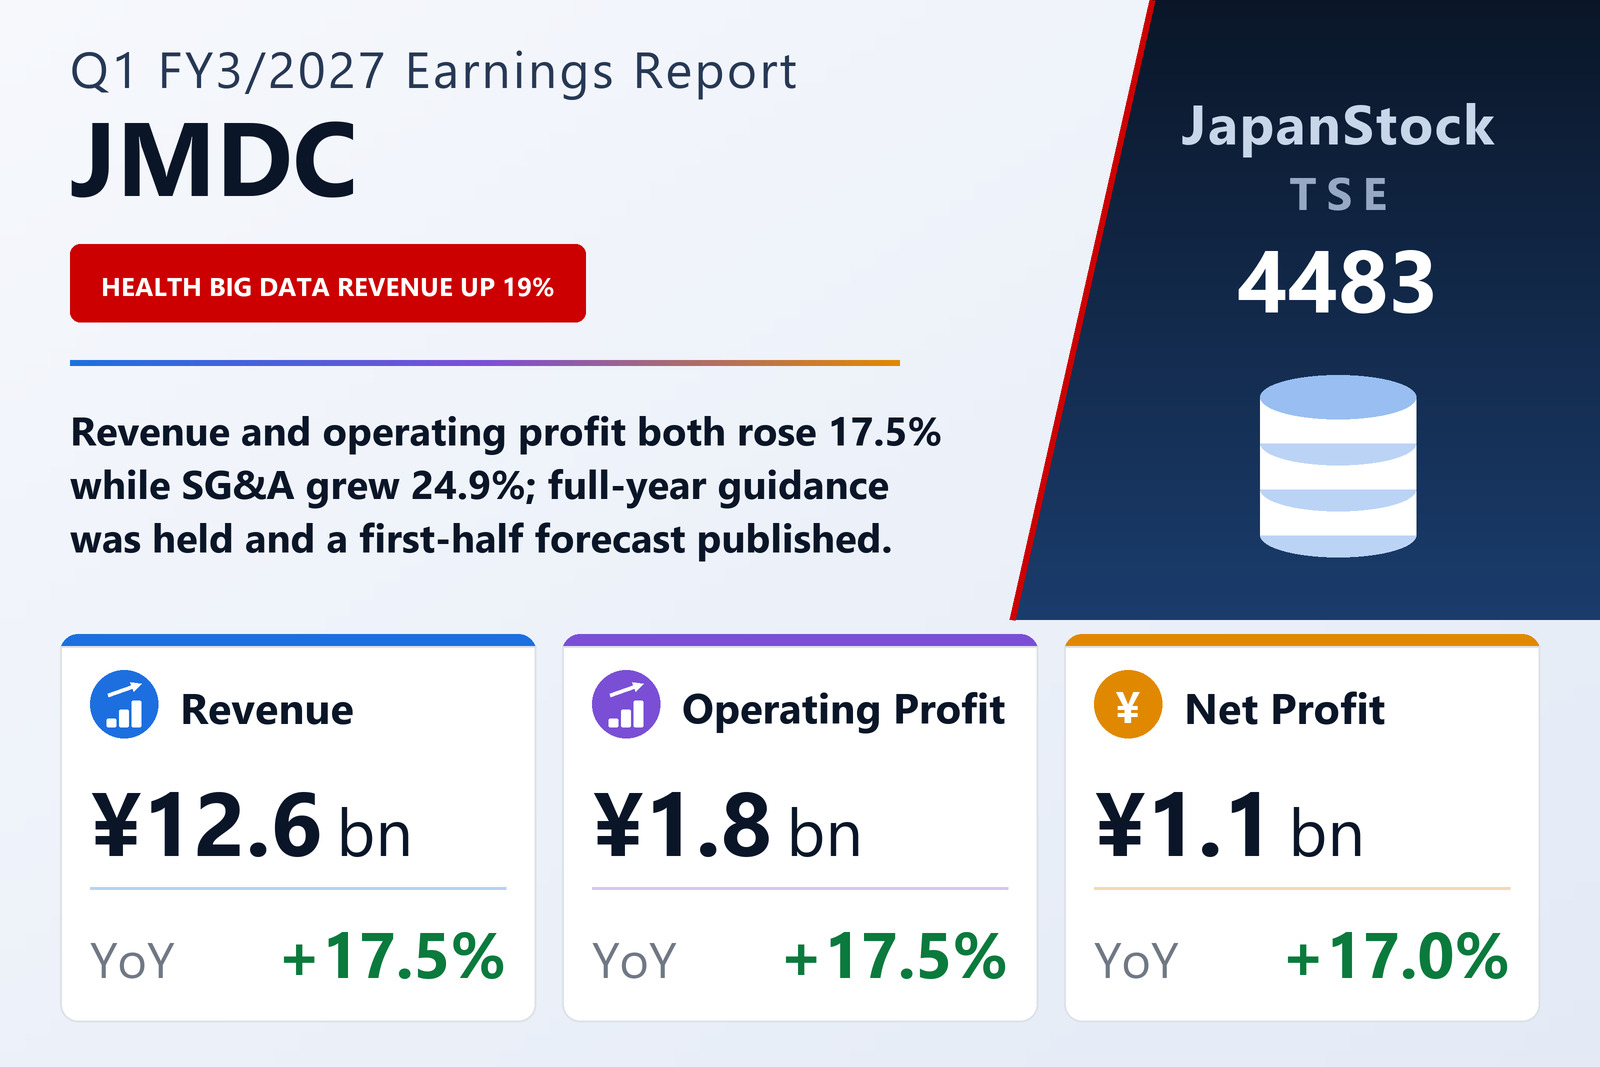
Revenue and operating profit both grew 17.5%, and the margin did not move
JMDC Inc. (TSE: 4483), which anonymises and analyses healthcare data gathered chiefly through health insurance societies and medical institutions, published consolidated results for the first quarter of the fiscal year ending March 2027 — the three months from April 1 to June 30, 2026 — on August 5, 2026, under International Financial Reporting Standards. Revenue rose 17.5% to ¥12,605 million, operating profit 17.5% to ¥1,823 million, pre-tax profit 17.1% to ¥1,688 million and profit attributable to owners of the parent 17.0% to ¥1,131 million. Basic earnings per share were ¥17.28 against ¥14.79. EBITDA, the measure the company uses to assess its segments, rose 17.4% to ¥2,663 million, a margin of 21.1% in both years. The shares are listed on the Tokyo Stock Exchange.
The two headline lines grew at the same rate, but the path between them matters. Cost of sales rose only 12.2% to ¥5,859 million, so gross profit climbed 22.6% to ¥6,745 million and the gross margin widened from 51.3% to 53.5%. Selling, general and administrative expenses, however, rose 24.9% to ¥4,962 million — an increase of ¥989 million that absorbed most of the ¥1,245 million gain in gross profit — lifting their ratio to revenue from 37.0% to 39.4%. Other income of ¥58 million against ¥32 million and other expenses of ¥17 million against ¥7 million changed little, and the operating margin ended at 14.5% in both quarters. The filing does not break down SG&A or explain why it grew faster than revenue.
Below the operating line: higher finance costs, a slightly lower tax rate and weaker comprehensive income
Finance income was ¥15 million against almost nothing a year earlier, while finance costs rose 36.0% to ¥151 million, so pre-tax profit grew a little more slowly than operating profit, by 17.1% to ¥1,688 million. Income tax expense of ¥555 million put the effective rate at about 32.9%, against 33.6%, and quarterly profit rose 18.3% to ¥1,132 million. Profit attributable to owners grew slightly less, 17.0% to ¥1,131 million, because non-controlling interests took a ¥1 million profit where a year earlier they had absorbed a ¥9 million loss. Comprehensive income moved the other way, falling 2.2% to ¥1,026 million: financial assets measured at fair value through other comprehensive income produced a ¥104 million loss against a ¥91 million gain, turning other comprehensive income from +¥92 million to −¥106 million.
Health Big Data supplies almost nine-tenths of revenue; Telemedicine widened its margin
JMDC reports two segments and measures both on EBITDA. Health Big Data — analysis services and a personal health record service for health insurers, data analysis, medical-fee factoring and drug databases for medical institutions, and the anonymised data it compiles for academic and industrial use — generated revenue of ¥10,955 million, up 19.1%, or 86.9% of the group total, and segment EBITDA of ¥2,250 million, up 17.2%. The filing says the number of client health insurance societies and similar bodies rose year on year, that annual transaction values with the pharmaceutical companies, insurers and other users of the data remained firm, and that the number of IDs issued on its Pep Up health-information platform kept growing. Because segment EBITDA grew more slowly than revenue, the margin slipped from 20.9% to 20.5%; the filing gives no reason for that.
Telemedicine, which matches medical institutions short of diagnostic radiologists with contracted radiologists through a remote image-reading system and provides a cloud-based ASP service for remote image diagnosis, grew revenue 8.2% to ¥1,649 million as the number of medical institutions using its remote reading services continued to rise. Its EBITDA grew faster, 21.9% to ¥653 million, taking the segment margin from 35.2% to 39.6%. The company says it is still adding functions to AI-RAD, its artificial-intelligence platform that assists image diagnosis, and preparing to expand the business in Asia. Adjustments for intersegment eliminations and corporate costs deepened to −¥240 million from −¥187 million, which reconciles the two segments' combined EBITDA of ¥2,903 million to the group's ¥2,663 million.
Receivables collected, borrowings and minority stakes reduced
Total assets fell 2.8% to ¥154,056 million from ¥158,538 million at March 31, 2026. The main movement was an ¥8,109 million fall in trade and other receivables, to ¥15,905 million, against increases of ¥1,830 million in cash and cash equivalents, ¥840 million in contract assets and ¥300 million in other current assets. Goodwill of ¥62,583 million remains the largest single asset, at about 41% of the total. Liabilities fell ¥3,503 million to ¥70,851 million, chiefly on lower trade payables (−¥1,541 million), income taxes payable reduced by payment (−¥1,063 million) and current borrowings (−¥995 million); current and non-current borrowings together stood at ¥40,440 million against ¥41,498 million. Total equity fell ¥978 million to ¥83,205 million as dividends of ¥1,177 million and ¥833 million of transactions with non-controlling interests outweighed quarterly profit of ¥1,132 million, and non-controlling interests shrank from ¥505 million to ¥141 million. The ratio of equity attributable to owners of the parent to total assets rose from 52.8% to 53.9%.
Operating activities generated ¥6,221 million against ¥5,372 million, driven mainly by the ¥8,111 million decrease in receivables, which outweighed a ¥1,554 million decrease in payables and ¥1,443 million of income taxes paid. Investing activities used only ¥968 million — chiefly ¥436 million for intangible assets, ¥195 million for property, plant and equipment and ¥136 million of loans extended — against ¥5,138 million a year earlier, when ¥4,530 million went on acquiring subsidiaries. Financing activities used ¥3,422 million, after an inflow of ¥3,225 million a year earlier, on ¥2,037 million of long-term loan repayments, ¥1,175 million of dividends and ¥833 million paid for shares in subsidiaries that did not change the scope of consolidation, partly offset by ¥980 million of new long-term borrowing. Cash and cash equivalents ended the quarter at ¥30,780 million.
Full-year guidance held, and a first-half forecast the company had not been giving
JMDC left its FY3/2027 guidance, published on May 8, 2026, unchanged: revenue of ¥60,500 million (+19.9%), operating profit of ¥11,500 million (+9.3%), pre-tax profit of ¥11,000 million (+10.4%), profit of ¥7,200 million (+5.7%) and profit attributable to owners of the parent of ¥7,100 million (+4.9%), or ¥108.19 per share, with EBITDA of ¥15,000 million (+13.8%). What is new is a forecast for the first half. The company's policy had been not to publish one, because its business is weighted towards the second half and first-half results are hard to predict; it now says business conditions have progressed smoothly and visibility for the first half has improved. For the six months to September 30, 2026 it expects revenue of ¥27,100 million (+17.4%), operating profit of ¥4,500 million (+11.8%), pre-tax profit of ¥4,100 million (+12.1%), profit attributable to owners of the parent of ¥2,650 million (+11.5%) and EBITDA of ¥6,100 million (+10.4%), against first-half FY3/2026 revenue of ¥23,080 million and operating profit of ¥4,025 million.
Measured against that forecast, the first quarter delivered 46.5% of first-half revenue but 40.5% of first-half operating profit. That implies second-quarter revenue of about ¥14,495 million, up 17.3% on the ¥12,355 million implied for the prior-year second quarter, and operating profit of about ¥2,677 million, up 8.2% on ¥2,473 million. On a full-year view the quarter supplied 20.8% of guided revenue and 15.9% of guided operating profit, consistent with the second-half weighting the company describes: the guidance leaves ¥7,000 million of operating profit for the second half, against ¥4,500 million forecast for the first. For dividends, FY3/2026 paid a year-end ¥18.00 per share; the filing shows no dividend forecast for FY3/2027.
| Metric | Q1 FY3/2027 | Q1 FY3/2026 | Change |
|---|---|---|---|
| Revenue (¥ million) | 12,605 | 10,725 | +17.5% |
| Cost of sales (¥ million) | 5,859 | 5,224 | +12.2% |
| Gross profit (¥ million) | 6,745 | 5,500 | +22.6% |
| Gross margin | 53.5% | 51.3% | +2.2 pt |
| SG&A expenses (¥ million) | 4,962 | 3,973 | +24.9% |
| EBITDA (¥ million) | 2,663 | 2,267 | +17.4% |
| Operating profit (¥ million) | 1,823 | 1,552 | +17.5% |
| Operating margin | 14.5% | 14.5% | 0.0 pt |
| Pre-tax profit (¥ million) | 1,688 | 1,441 | +17.1% |
| Net profit (¥ million) | 1,132 | 957 | +18.3% |
| Net profit attrib. to owners of parent (¥ million) | 1,131 | 966 | +17.0% |
| Comprehensive income (¥ million) | 1,026 | 1,049 | −2.2% |
| EPS (¥) | 17.28 | 14.79 | +16.8% |
| Health Big Data — revenue (¥ million) | 10,955 | 9,201 | +19.1% |
| Health Big Data — segment EBITDA (¥ million) | 2,250 | 1,919 | +17.2% |
| Telemedicine — revenue (¥ million) | 1,649 | 1,524 | +8.2% |
| Telemedicine — segment EBITDA (¥ million) | 653 | 536 | +21.9% |
| Total assets (¥ million) | 154,056 | 158,538 | −2.8% |
| Total equity (¥ million) | 83,205 | 84,183 | −1.2% |
| Equity attrib. to owners of parent (¥ million) | 83,063 | 83,677 | −0.7% |
| Equity ratio | 53.9% | 52.8% | +1.1 pt |
| Cash and cash equivalents (¥ million) | 30,780 | 28,950 | +6.3% |
| Operating cash flow, Q1 (¥ million) | 6,221 | 5,372 | +15.8% |
| FY3/2027 guidance — revenue (¥ million) | 60,500 | — | +19.9% |
| FY3/2027 guidance — EBITDA (¥ million) | 15,000 | — | +13.8% |
| FY3/2027 guidance — operating profit (¥ million) | 11,500 | — | +9.3% |
| FY3/2027 guidance — pre-tax profit (¥ million) | 11,000 | — | +10.4% |
| FY3/2027 guidance — profit attrib. to owners of parent (¥ million) | 7,100 | — | +4.9% |
| FY3/2027 guidance — EPS (¥) | 108.19 | — | — |
| Annual dividend per share (¥) | — | 18.00 | — |
JapanStockPulse provides informational content only and does not constitute investment advice. Figures are taken from the company's published earnings short report and may be subject to subsequent revision.