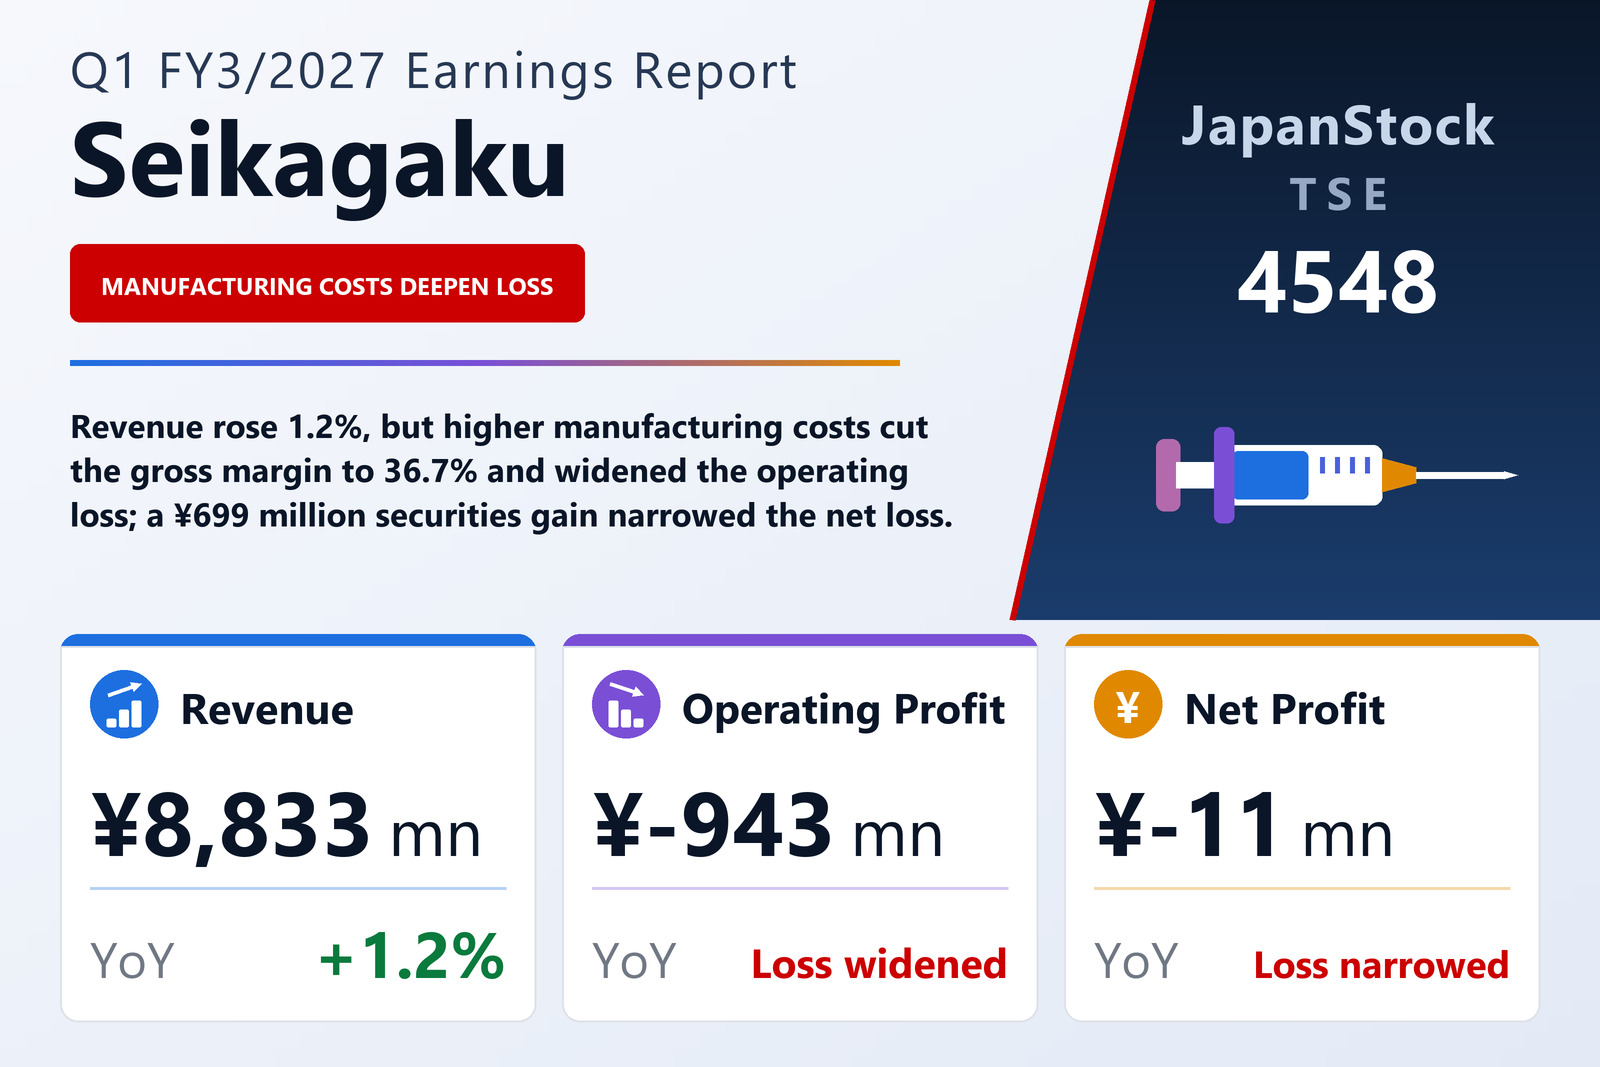
Revenue grew ¥102 million; cost of sales grew ¥554 million
Seikagaku Corporation (TSE: 4548), a drug maker specialising in glycoscience that has no sales organisation of its own and instead entrusts the marketing of its products to partner companies in Japan and abroad, published consolidated first-quarter results for the three months from April 1 to June 30, 2026 on August 5, 2026 under Japanese GAAP. Revenue rose 1.2% to ¥8,833 million. The operating loss widened to ¥943 million from ¥365 million, ordinary profit swung to ¥108 million from a loss of ¥132 million, and the loss attributable to owners of the parent narrowed to ¥11 million from ¥200 million, or ¥0.21 per share against ¥3.68. The filing states that the quarterly statements were not reviewed by an auditor.
The arithmetic of the quarter is short. Revenue rose by ¥102 million, while cost of sales rose by ¥554 million, or 11.0% to ¥5,591 million, which the filing attributes to higher manufacturing costs without breaking them down further. Gross profit therefore fell 12.3% to ¥3,241 million and the gross margin narrowed from 42.3% to 36.7%. Selling, general and administrative expenses rose 3.1% to ¥4,185 million even though research and development spending, the largest item within them, fell to ¥1,619 million from ¥1,691 million; the line the filing labels simply as other expenses rose to ¥1,582 million from ¥1,397 million, and the filing does not explain it. The ¥453 million fall in gross profit and the ¥126 million rise in SG&A together account for the ¥578 million deterioration at the operating line.
A securities sale, not trading, put ordinary profit in the black
Non-operating income almost quadrupled, to ¥1,062 million from ¥273 million. The difference is essentially one item: a ¥699 million gain on the sale of investment securities, against none a year earlier. Dividend income contributed ¥253 million, interest income ¥21 million, and a foreign-exchange gain of ¥74 million replaced a ¥32 million exchange loss. Non-operating expenses were ¥10 million, including a ¥6 million loss on a debt guarantee. That was enough to turn the ¥943 million operating loss into ordinary profit of ¥108 million. There were no extraordinary items, so pre-tax profit was also ¥108 million.
Income taxes of ¥119 million — ¥82 million current and ¥37 million deferred, against ¥67 million in total a year earlier — exceeded that pre-tax figure, which is why the quarter still closed with a net loss of ¥11 million; the filing names higher tax expense as the reason, and notes that quarterly tax is calculated by applying an estimated effective rate for the full year. Comprehensive income was a loss of ¥290 million against ¥738 million: the valuation difference on securities swung to −¥490 million from +¥429 million, while foreign-currency translation turned positive at +¥293 million from −¥933 million.
Overseas joint treatments fell 45.9% — on shipment timing, the filing says
The Pharmaceuticals segment's revenue fell 7.7% to ¥5,448 million and its segment loss widened to ¥1,167 million from ¥479 million. Domestic pharmaceuticals rose 2.9% to ¥3,100 million, mainly on higher shipments of the Opegan ophthalmic surgical aids; the company says both its ARTZ joint-function treatment and Opegan kept the top share in their markets. Overseas pharmaceuticals fell 45.9% to ¥1,054 million, mainly because of lower sales of Gel-One and SUPARTZ FX, two joint-function treatments sold in the United States, and the filing states that both declines were caused by the timing of shipments. Active pharmaceutical ingredients and contract manufacturing grew 34.2% to ¥1,260 million, and royalties were ¥33 million against ¥1 million. The company notes that its royalties are mainly milestone-based, received as development and sales progress.
The market commentary is cautious. In the US joint-treatment market, the company says patient numbers are rising but intense price competition limits growth in value terms; China's market is expanding gradually as its elderly population grows. It adds that the effect of US government policy on the drug industry remains unclear and that centralised procurement by China's national and provincial governments is spreading, making market trends hard to predict.
LAL grew 19.7% and nearly doubled its profit
The LAL segment, which sells reagents used mainly for quality control in drug manufacturing, grew revenue 19.7% to ¥3,385 million, on strong overseas sales of endotoxin-detection reagents and of in-vitro diagnostics that measure glucan. Its segment profit rose to ¥223 million from ¥113 million, an increase of 97.3% that the filing does not state and which is computed from the two amounts. LAL now accounts for 38.3% of group revenue, but its profit covered less than a fifth of the Pharmaceuticals segment's loss. The company expects the endotoxin-reagent market, including recombinant products made without animal-derived raw materials, to grow steadily, and the glucan-diagnostics market, led by the United States, to keep expanding.
Cash and securities fell; the equity ratio rose to 87.8%
Total assets fell ¥1,854 million to ¥84,490 million from March 31, 2026, mainly on lower cash and deposits, which went to ¥7,310 million from ¥8,938 million, and lower investment securities, which went to ¥14,404 million from ¥15,722 million. Liabilities fell ¥744 million to ¥10,300 million, mainly on lower accounts payable – other, and net assets fell ¥1,109 million to ¥74,189 million, mainly on lower retained earnings. Because equity fell more slowly than total assets, the equity ratio rose from 87.2% to 87.8%. Construction in progress stood at ¥8,979 million against ¥8,662 million. No quarterly cash-flow statement was prepared; depreciation was ¥560 million against ¥484 million.
Guidance and a ¥30 dividend held; a new adhesion barrier approved
Seikagaku left its full-year FY3/2027 guidance, published on May 13, 2026, unchanged: revenue of ¥41,850 million (+14.2%), operating profit of ¥2,050 million, ordinary profit of ¥4,200 million (+150.0%) and profit attributable to owners of ¥2,250 million (+52.7%), for earnings of ¥41.21 per share. The first quarter delivered 21.1% of guided revenue, and reaching the operating target from a ¥943 million first-quarter loss implies operating profit of roughly ¥2,993 million over the remaining nine months; the filing gives no quarterly phasing. The dividend forecast is also unchanged, at ¥15.00 for the interim and ¥15.00 at the year-end, for an annual ¥30.00, the same as FY3/2026.
On research, spending of ¥1,619 million equalled 18.4% of revenue excluding royalties. The filing reports one material step: SI-449, an adhesion barrier developed for Japan, received medical-device manufacturing and marketing approval in April 2026, with Covidien Japan chosen as its sales partner. It is a powder whose main component is a cross-linked chondroitin sulfate made with the company's own glycosaminoglycan cross-linking technology, designed to swell after application and act as a barrier between the surgical wound and surrounding tissue; the company says clinical trials confirmed its effect in preventing post-operative adhesions and that it is developing the product with a global rollout in view. The filing reports no other significant change to its research activities.
| Metric | Q1 FY3/2027 | Q1 FY3/2026 | Change |
|---|---|---|---|
| Revenue (¥ million) | 8,833 | 8,731 | +1.2% |
| Cost of sales (¥ million) | 5,591 | 5,037 | +11.0% |
| Gross profit (¥ million) | 3,241 | 3,694 | −12.3% |
| Gross margin | 36.7% | 42.3% | −5.6 pt |
| SG&A expenses (¥ million) | 4,185 | 4,059 | +3.1% |
| — of which R&D expenses (¥ million) | 1,619 | 1,691 | −4.3% |
| Operating profit (¥ million) | −943 | −365 | loss widened |
| Ordinary profit (¥ million) | 108 | −132 | loss to profit |
| Net profit attrib. to owners of parent (¥ million) | −11 | −200 | loss narrowed |
| EPS (¥) | −0.21 | −3.68 | loss narrowed |
| Comprehensive income (¥ million) | −290 | −738 | loss narrowed |
| Pharmaceuticals — revenue (¥ million) | 5,448 | 5,901 | −7.7% |
| — Domestic pharmaceuticals (¥ million) | 3,100 | 3,012 | +2.9% |
| — Overseas pharmaceuticals (¥ million) | 1,054 | 1,948 | −45.9% |
| — APIs & contract manufacturing (¥ million) | 1,260 | 939 | +34.2% |
| Pharmaceuticals — segment profit (¥ million) | −1,167 | −479 | loss widened |
| LAL — revenue (¥ million) | 3,385 | 2,829 | +19.7% |
| LAL — segment profit (¥ million) | 223 | 113 | +97.3% |
| Total assets (¥ million) | 84,490 | 86,344 | −2.1% |
| Net assets (¥ million) | 74,189 | 75,299 | −1.5% |
| Equity ratio | 87.8% | 87.2% | +0.6 pt |
| FY3/2027 guidance — revenue (¥ million) | 41,850 | — | +14.2% |
| FY3/2027 guidance — operating profit (¥ million) | 2,050 | — | n.m. |
| FY3/2027 guidance — ordinary profit (¥ million) | 4,200 | — | +150.0% |
| FY3/2027 guidance — net profit (¥ million) | 2,250 | — | +52.7% |
| Annual dividend per share (¥) | 30.00 | 30.00 | unchanged |
JapanStockPulse provides informational content only and does not constitute investment advice. Figures are taken from the company's published earnings short report and may be subject to subsequent revision.